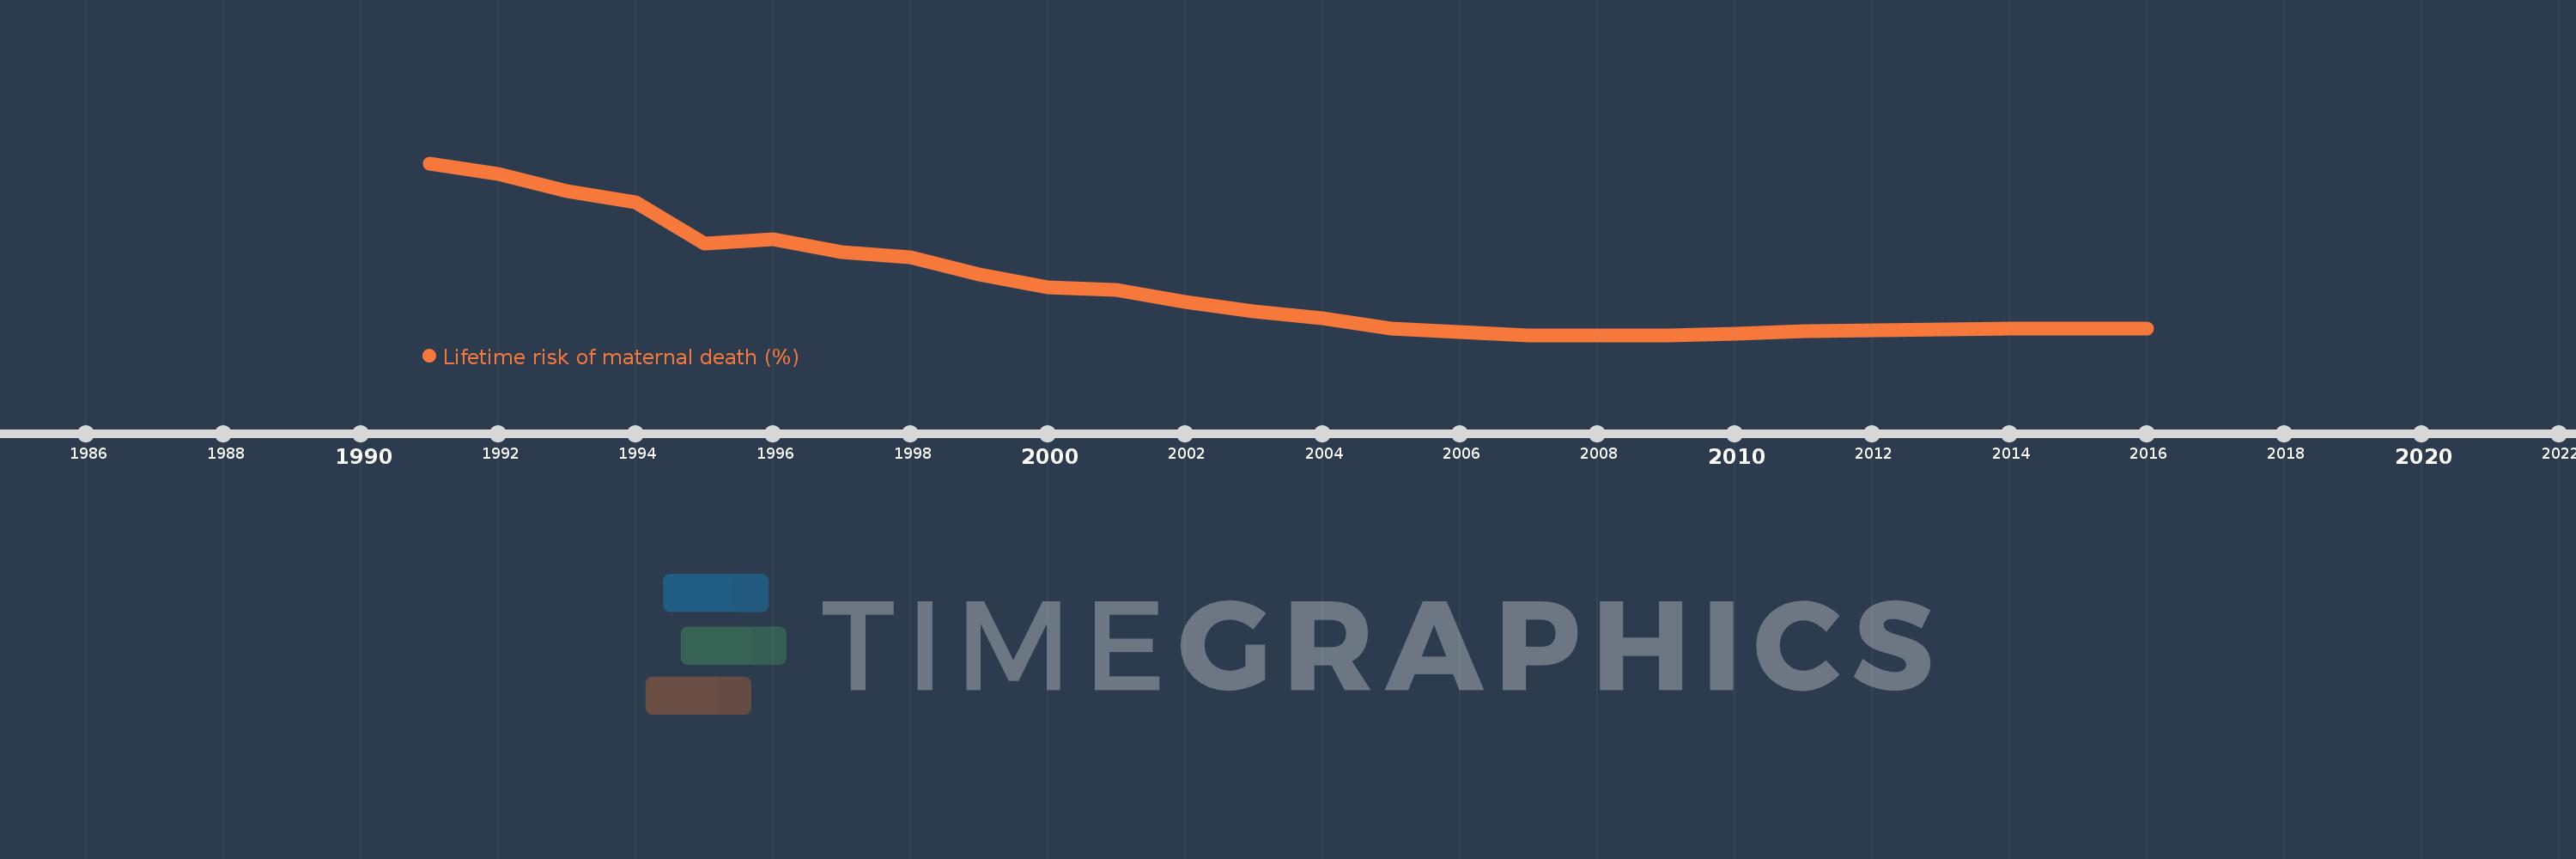
This timeline shows a graph from 1991 to 2016 of Albania. No data until 1990. Number of actual observations by date: 26.
Source name:
World Development Indicators
Source organization:
WHO, UNICEF, UNFPA, The World Bank, and the United Nations Population Division. Trends in Maternal Mortality: 1990 to 2015. Geneva, World Health Organization, 2015
Categories, topics:
Health, Gender
Last updated:
apr 23, 2017
Indicators value changes by year
Meaning:
0.098
Minimum:
0.046
jan 1, 2008
Maximum:
0.234
jan 1, 1991
At the date of observation
Value
Absolute change
Change from the previous value
jan 1, 1991
0.234
+0.234
0.0%
jan 1, 1992
0.222
-0.012
-5.17%
jan 1, 1993
0.203
-0.019
-8.43%
jan 1, 1994
0.191
-0.012
-5.73%
jan 1, 1995
0.146
-0.046
-23.8%
jan 1, 1996
0.151
+0.005
3.26%
jan 1, 1997
0.137
-0.014
-9.06%
jan 1, 1998
0.131
-0.006
-4.5%
jan 1, 1999
0.112
-0.018
-14.08%
jan 1, 2000
0.098
-0.015
-13.05%
jan 1, 2001
0.095
-0.003
-2.62%
jan 1, 2002
0.082
-0.013
-13.6%
jan 1, 2003
0.072
-0.01
-12.69%
jan 1, 2004
0.064
-0.008
-10.7%
jan 1, 2005
0.053
-0.011
-17.24%
jan 1, 2006
0.049
-0.004
-8.46%
jan 1, 2007
0.046
-0.003
-5.2%
jan 1, 2008
0.046
0.0
-0.78%
jan 1, 2009
0.046
+0.0
0.18%
jan 1, 2010
0.047
+0.001
2.91%
jan 1, 2011
0.05
+0.002
5.29%
jan 1, 2012
0.051
+0.001
2.11%
jan 1, 2013
0.052
+0.001
2.41%
jan 1, 2014
0.053
+0.001
1.4%
jan 1, 2015
0.053
+0.0
0.53%
jan 1, 2016
0.053
+0.0
0.91%
Ranking of countries by current statistics by years