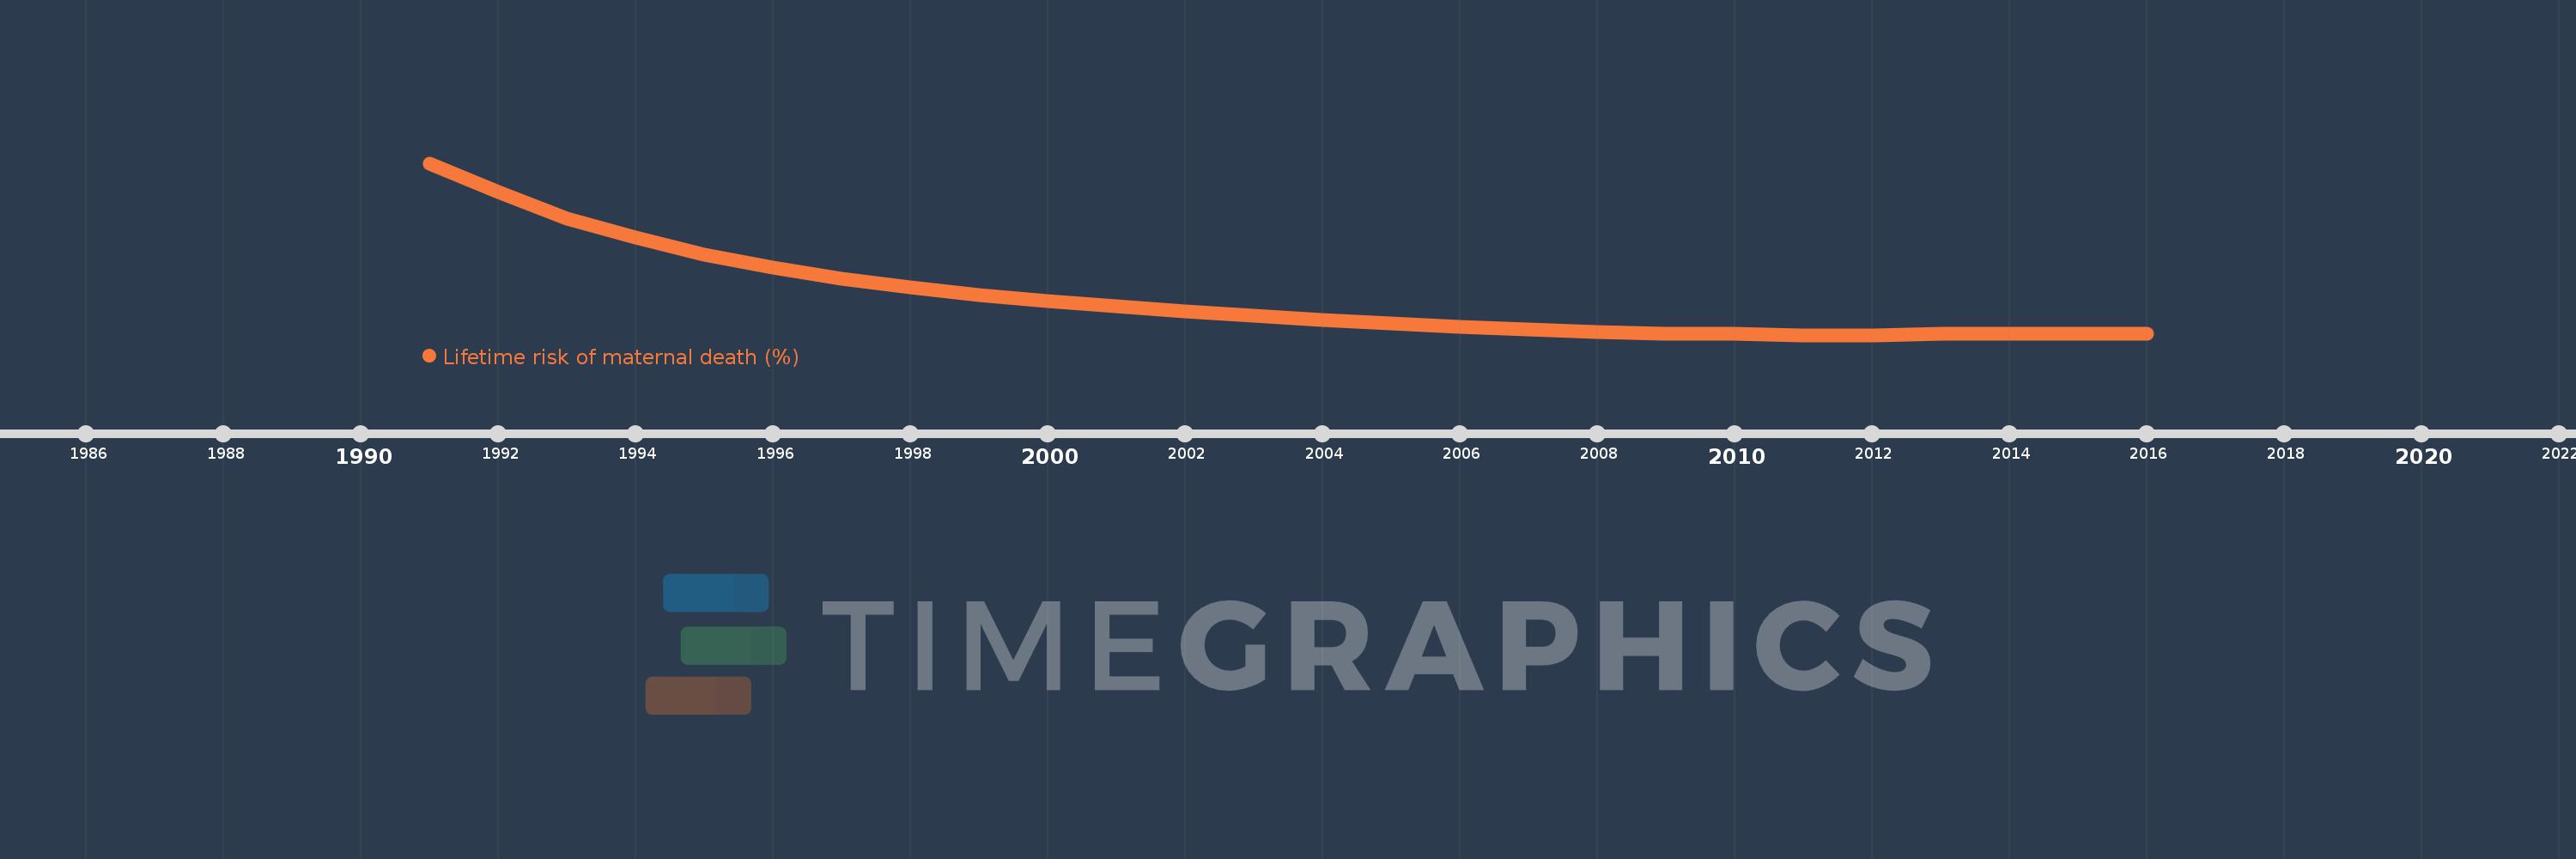
This timeline shows a graph from 1991 to 2016 of Libya. No data until 1990. Number of actual observations by date: 26.
Source name:
World Development Indicators
Source organization:
WHO, UNICEF, UNFPA, The World Bank, and the United Nations Population Division. Trends in Maternal Mortality: 1990 to 2015. Geneva, World Health Organization, 2015
Categories, topics:
Health, Gender
Last updated:
apr 23, 2017
Indicators value changes by year
Meaning:
0.056
Minimum:
0.023
jan 1, 2012
Maximum:
0.173
jan 1, 1991
At the date of observation
Value
Absolute change
Change from the previous value
jan 1, 1991
0.173
+0.173
0.0%
jan 1, 1992
0.148
-0.026
-14.82%
jan 1, 1993
0.125
-0.022
-15.11%
jan 1, 1994
0.108
-0.018
-14.06%
jan 1, 1995
0.093
-0.014
-13.19%
jan 1, 1996
0.082
-0.011
-12.13%
jan 1, 1997
0.072
-0.01
-11.78%
jan 1, 1998
0.065
-0.007
-10.29%
jan 1, 1999
0.058
-0.007
-10.08%
jan 1, 2000
0.053
-0.005
-9.32%
jan 1, 2001
0.048
-0.005
-9.13%
jan 1, 2002
0.044
-0.005
-9.37%
jan 1, 2003
0.04
-0.004
-9.18%
jan 1, 2004
0.036
-0.003
-8.57%
jan 1, 2005
0.033
-0.003
-8.9%
jan 1, 2006
0.03
-0.003
-8.66%
jan 1, 2007
0.028
-0.002
-7.49%
jan 1, 2008
0.026
-0.002
-6.36%
jan 1, 2009
0.024
-0.002
-6.28%
jan 1, 2010
0.024
-0.001
-2.62%
jan 1, 2011
0.023
-0.001
-3.09%
jan 1, 2012
0.023
0.0
-1.93%
jan 1, 2013
0.024
+0.001
4.56%
jan 1, 2014
0.024
+0.001
2.98%
jan 1, 2015
0.024
0.0
-1.65%
jan 1, 2016
0.024
+0.0
0.33%
Ranking of countries by current statistics by years