33
/
AIzaSyAYiBZKx7MnpbEhh9jyipgxe19OcubqV5w
May 1, 2025
136954
Gambia, The
GMB
true
2
1
Lifetime risk of maternal death (%)
2016,2015,2014,2013,2012,2011,2010,2009,2008,2007,2006,2005,2004,2003,2002,2001,2000,1999,1998,1997,1996,1995,1994,1993,1992,1991
Download
Global statistics library →Gambia, The →

Lifetime risk of maternal death (%)

This statistics in other country:

AfghanistanAlbaniaAlgeriaAngolaArab WorldArgentinaArmeniaAustraliaAustriaAzerbaijanBahamas, TheBahrainBangladeshBarbadosBelarusBelgiumBelizeBeninBhutanBoliviaBosnia and HerzegovinaBotswanaBrazilBrunei DarussalamBulgariaBurkina FasoBurundiCabo VerdeCambodiaCameroonCanadaCaribbean small statesCentral African RepublicCentral Europe and the BalticsChadChileChinaColombiaComorosCongo, Dem. Rep.Congo, Rep.Costa RicaCote d'IvoireCroatiaCubaCyprusCzech RepublicDenmarkDjiboutiDominican RepublicEarly-demographic dividendEast Asia & PacificEast Asia & Pacific (excluding high income)East Asia & Pacific (IDA & IBRD countries)EcuadorEgypt, Arab Rep.El SalvadorEquatorial GuineaEritreaEstoniaEthiopiaEuro areaEurope & Central AsiaEurope & Central Asia (excluding high income)Europe & Central Asia (IDA & IBRD countries)European UnionFijiFinlandFragile and conflict affected situationsFranceGabonGambia, TheGeorgiaGermanyGhanaGreeceGrenadaGuatemalaGuineaGuinea-BissauGuyanaHaitiHeavily indebted poor countries (HIPC)High incomeHondurasHungaryIBRD onlyIcelandIDA & IBRD totalIDA blendIDA onlyIDA totalIndiaIndonesiaIran, Islamic Rep.IraqIrelandIsraelItalyJamaicaJapanJordanKazakhstanKenyaKiribatiKorea, Dem. People’s Rep.Korea, Rep.KuwaitKyrgyz RepublicLao PDRLate-demographic dividendLatin America & Caribbean Latin America & Caribbean (excluding high income)Latin America & the Caribbean (IDA & IBRD countries)LatviaLeast developed countries: UN classificationLebanonLesothoLiberiaLibyaLithuaniaLow & middle incomeLow incomeLower middle incomeLuxembourgMacedonia, FYRMadagascarMalawiMalaysiaMaldivesMaliMaltaMauritaniaMauritiusMexicoMicronesia, Fed. Sts.Middle East & North AfricaMiddle East & North Africa (excluding high income)Middle East & North Africa (IDA & IBRD countries)Middle incomeMoldovaMongoliaMontenegroMoroccoMozambiqueMyanmarNamibiaNepalNetherlandsNew ZealandNicaraguaNigerNigeriaNorth AmericaNorwayOECD membersOmanOther small statesPacific island small statesPakistanPanamaPapua New GuineaParaguayPeruPhilippinesPolandPortugalPost-demographic dividendPre-demographic dividendPuerto RicoQatarRomaniaRussian FederationRwandaSamoaSao Tome and PrincipeSaudi ArabiaSenegalSerbiaSierra LeoneSingaporeSlovak RepublicSloveniaSmall statesSolomon IslandsSomaliaSouth AfricaSouth AsiaSouth Asia (IDA & IBRD)South SudanSpainSri LankaSt. LuciaSt. Vincent and the GrenadinesSub-Saharan Africa Sub-Saharan Africa (excluding high income)Sub-Saharan Africa (IDA & IBRD countries)SudanSurinameSwazilandSwedenSwitzerlandSyrian Arab RepublicTajikistanTanzaniaThailandTimor-LesteTogoTongaTrinidad and TobagoTunisiaTurkeyTurkmenistanUgandaUkraineUnited Arab EmiratesUnited KingdomUnited StatesUpper middle incomeUruguayUzbekistanVanuatuVenezuela, RBVietnamWest Bank and GazaWorldYemen, Rep.ZambiaZimbabwe

Timeline:

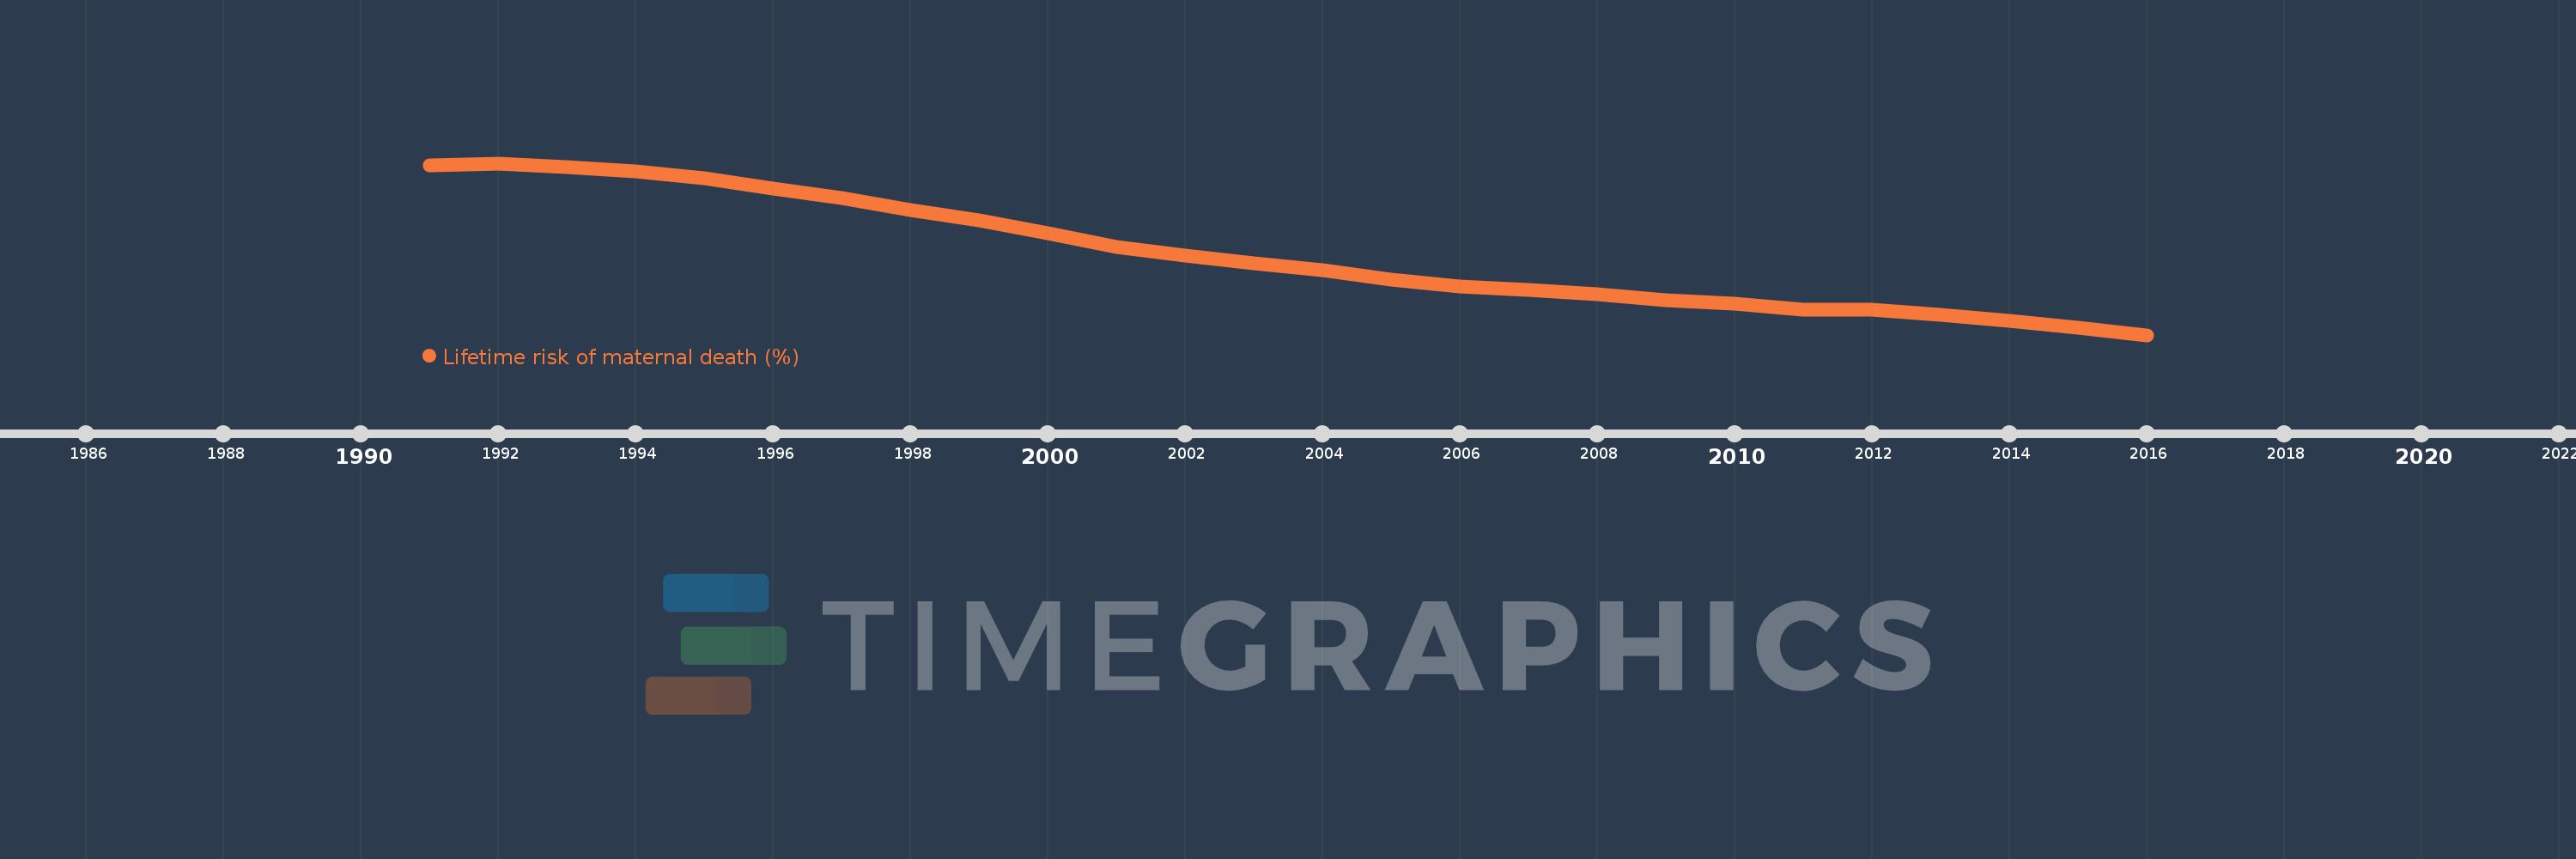
This timeline shows a graph from 1991 to 2016 of Gambia, The. No data until 1990. Number of actual observations by date: 26.

Source name:

World Development Indicators

Source organization:

WHO, UNICEF, UNFPA, The World Bank, and the United Nations Population Division. Trends in Maternal Mortality: 1990 to 2015. Geneva, World Health Organization, 2015

Categories, topics:

Health, Gender

Last updated:

apr 23, 2017

Indicators value changes by year

Meaning:
5.35
Minimum:
4.111
jan 1, 2016
Maximum:
6.736
jan 1, 1992
At the date of observation
Value
Absolute change
Change from the previous value
jan 1, 1991
6.697
+6.697
0.0%
jan 1, 1992
6.736
+0.04
0.59%
jan 1, 1993
6.679
-0.058
-0.86%
jan 1, 1994
6.613
-0.065
-0.98%
jan 1, 1995
6.507
-0.107
-1.61%
jan 1, 1996
6.345
-0.161
-2.48%
jan 1, 1997
6.2
-0.145
-2.29%
jan 1, 1998
6.022
-0.177
-2.86%
jan 1, 1999
5.867
-0.155
-2.58%
jan 1, 2000
5.66
-0.207
-3.54%
jan 1, 2001
5.459
-0.201
-3.55%
jan 1, 2002
5.326
-0.133
-2.44%
jan 1, 2003
5.21
-0.116
-2.17%
jan 1, 2004
5.103
-0.106
-2.04%
jan 1, 2005
4.964
-0.139
-2.73%
jan 1, 2006
4.854
-0.11
-2.21%
jan 1, 2007
4.8
-0.054
-1.11%
jan 1, 2008
4.737
-0.063
-1.32%
jan 1, 2009
4.641
-0.096
-2.03%
jan 1, 2010
4.594
-0.047
-1.0%
jan 1, 2011
4.498
-0.097
-2.11%
jan 1, 2012
4.5
+0.002
0.05%
jan 1, 2013
4.423
-0.076
-1.7%
jan 1, 2014
4.332
-0.092
-2.08%
jan 1, 2015
4.228
-0.103
-2.39%
jan 1, 2016
4.111
-0.117
-2.77%

Ranking of countries by current statistics by years