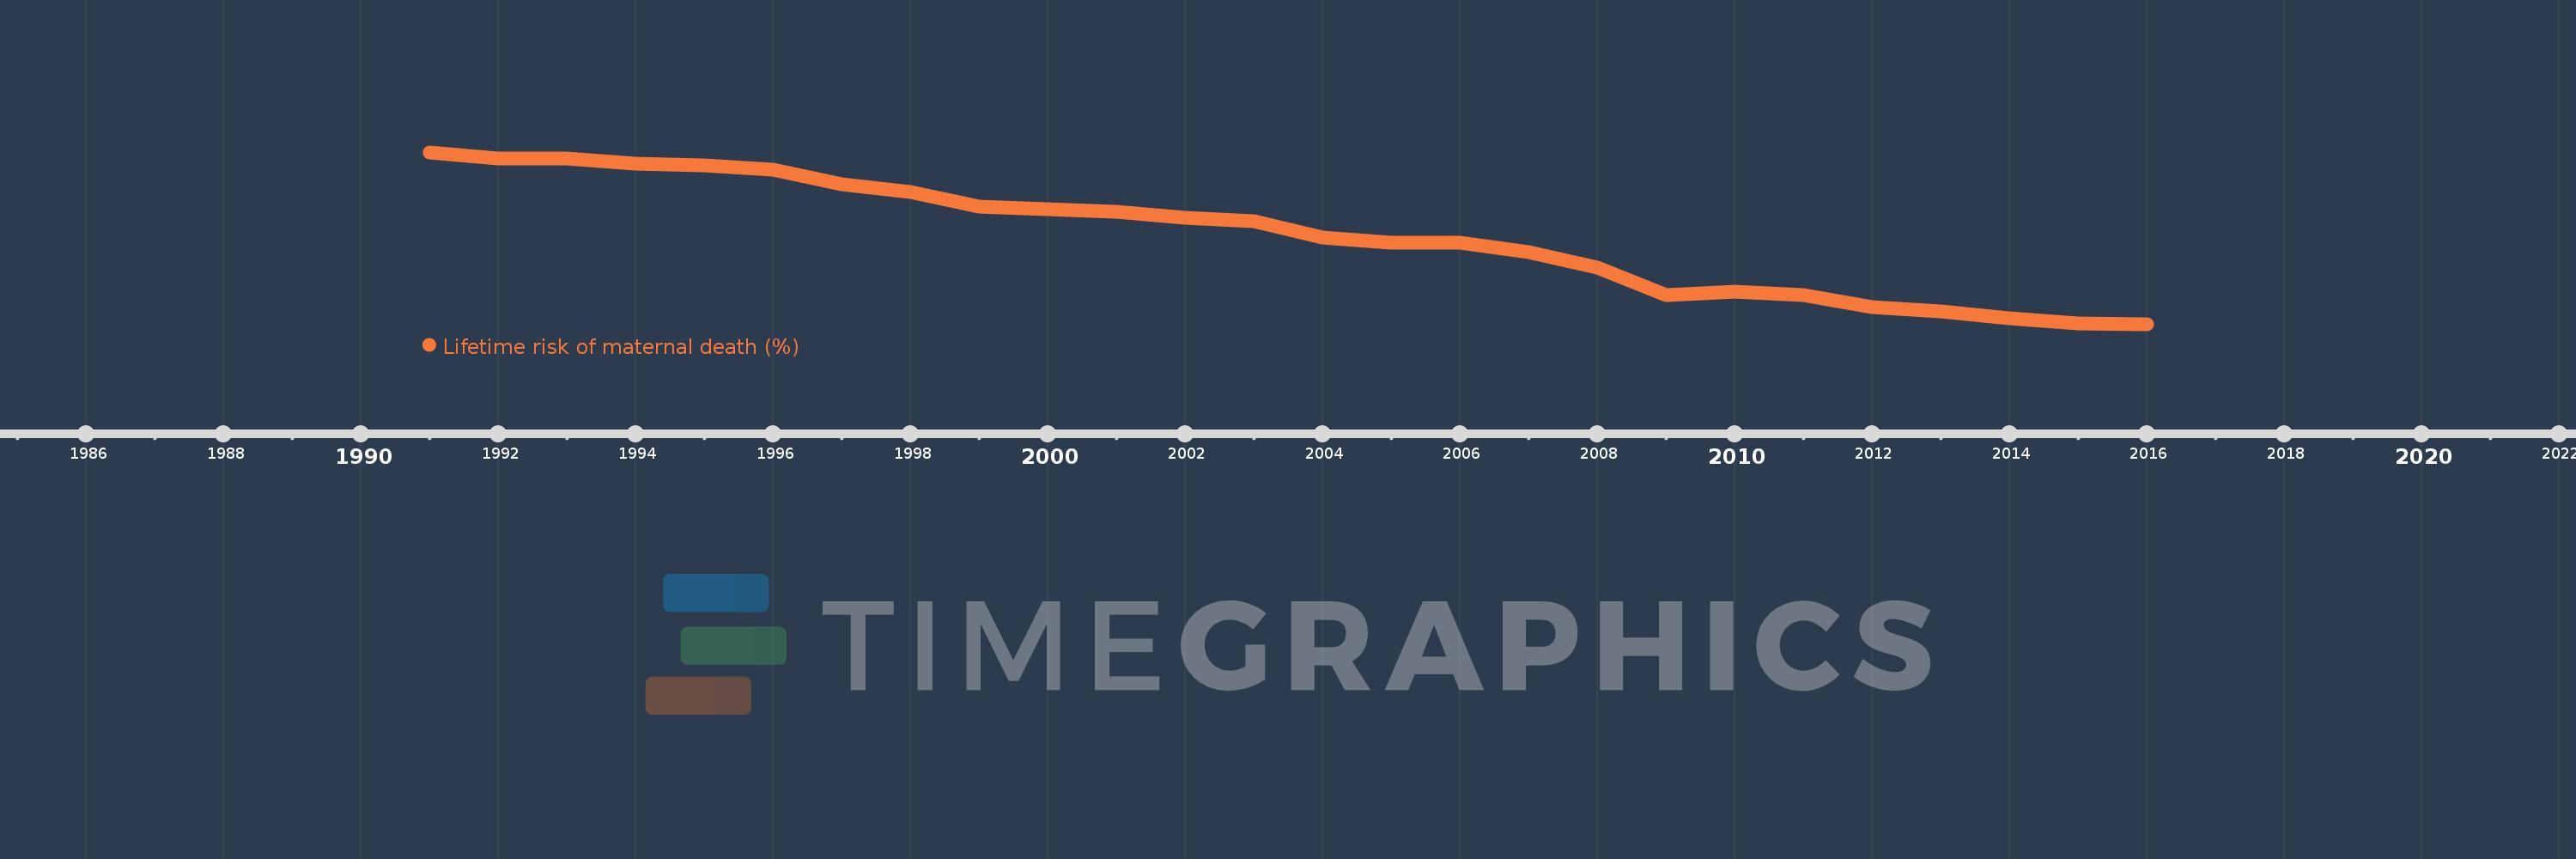
This timeline shows a graph from 1991 to 2016 of Belize. No data until 1990. Number of actual observations by date: 26.
Source name:
World Development Indicators
Source organization:
WHO, UNICEF, UNFPA, The World Bank, and the United Nations Population Division. Trends in Maternal Mortality: 1990 to 2015. Geneva, World Health Organization, 2015
Categories, topics:
Health, Gender
Last updated:
apr 23, 2017
Indicators value changes by year
Meaning:
0.19
Minimum:
0.079
jan 1, 2016
Maximum:
0.294
jan 1, 1991
At the date of observation
Value
Absolute change
Change from the previous value
jan 1, 1991
0.294
+0.294
0.0%
jan 1, 1992
0.286
-0.008
-2.74%
jan 1, 1993
0.286
+0.001
0.18%
jan 1, 1994
0.28
-0.007
-2.27%
jan 1, 1995
0.278
-0.002
-0.64%
jan 1, 1996
0.272
-0.006
-2.19%
jan 1, 1997
0.254
-0.018
-6.66%
jan 1, 1998
0.244
-0.01
-3.9%
jan 1, 1999
0.226
-0.018
-7.36%
jan 1, 2000
0.223
-0.003
-1.37%
jan 1, 2001
0.22
-0.003
-1.53%
jan 1, 2002
0.212
-0.008
-3.61%
jan 1, 2003
0.208
-0.003
-1.57%
jan 1, 2004
0.188
-0.021
-9.93%
jan 1, 2005
0.181
-0.007
-3.76%
jan 1, 2006
0.181
+0.0
0.03%
jan 1, 2007
0.169
-0.011
-6.33%
jan 1, 2008
0.15
-0.019
-11.14%
jan 1, 2009
0.115
-0.035
-23.52%
jan 1, 2010
0.12
+0.005
4.57%
jan 1, 2011
0.115
-0.005
-4.56%
jan 1, 2012
0.1
-0.015
-12.82%
jan 1, 2013
0.095
-0.005
-5.15%
jan 1, 2014
0.086
-0.009
-9.31%
jan 1, 2015
0.08
-0.006
-6.85%
jan 1, 2016
0.079
-0.001
-1.28%
Ranking of countries by current statistics by years