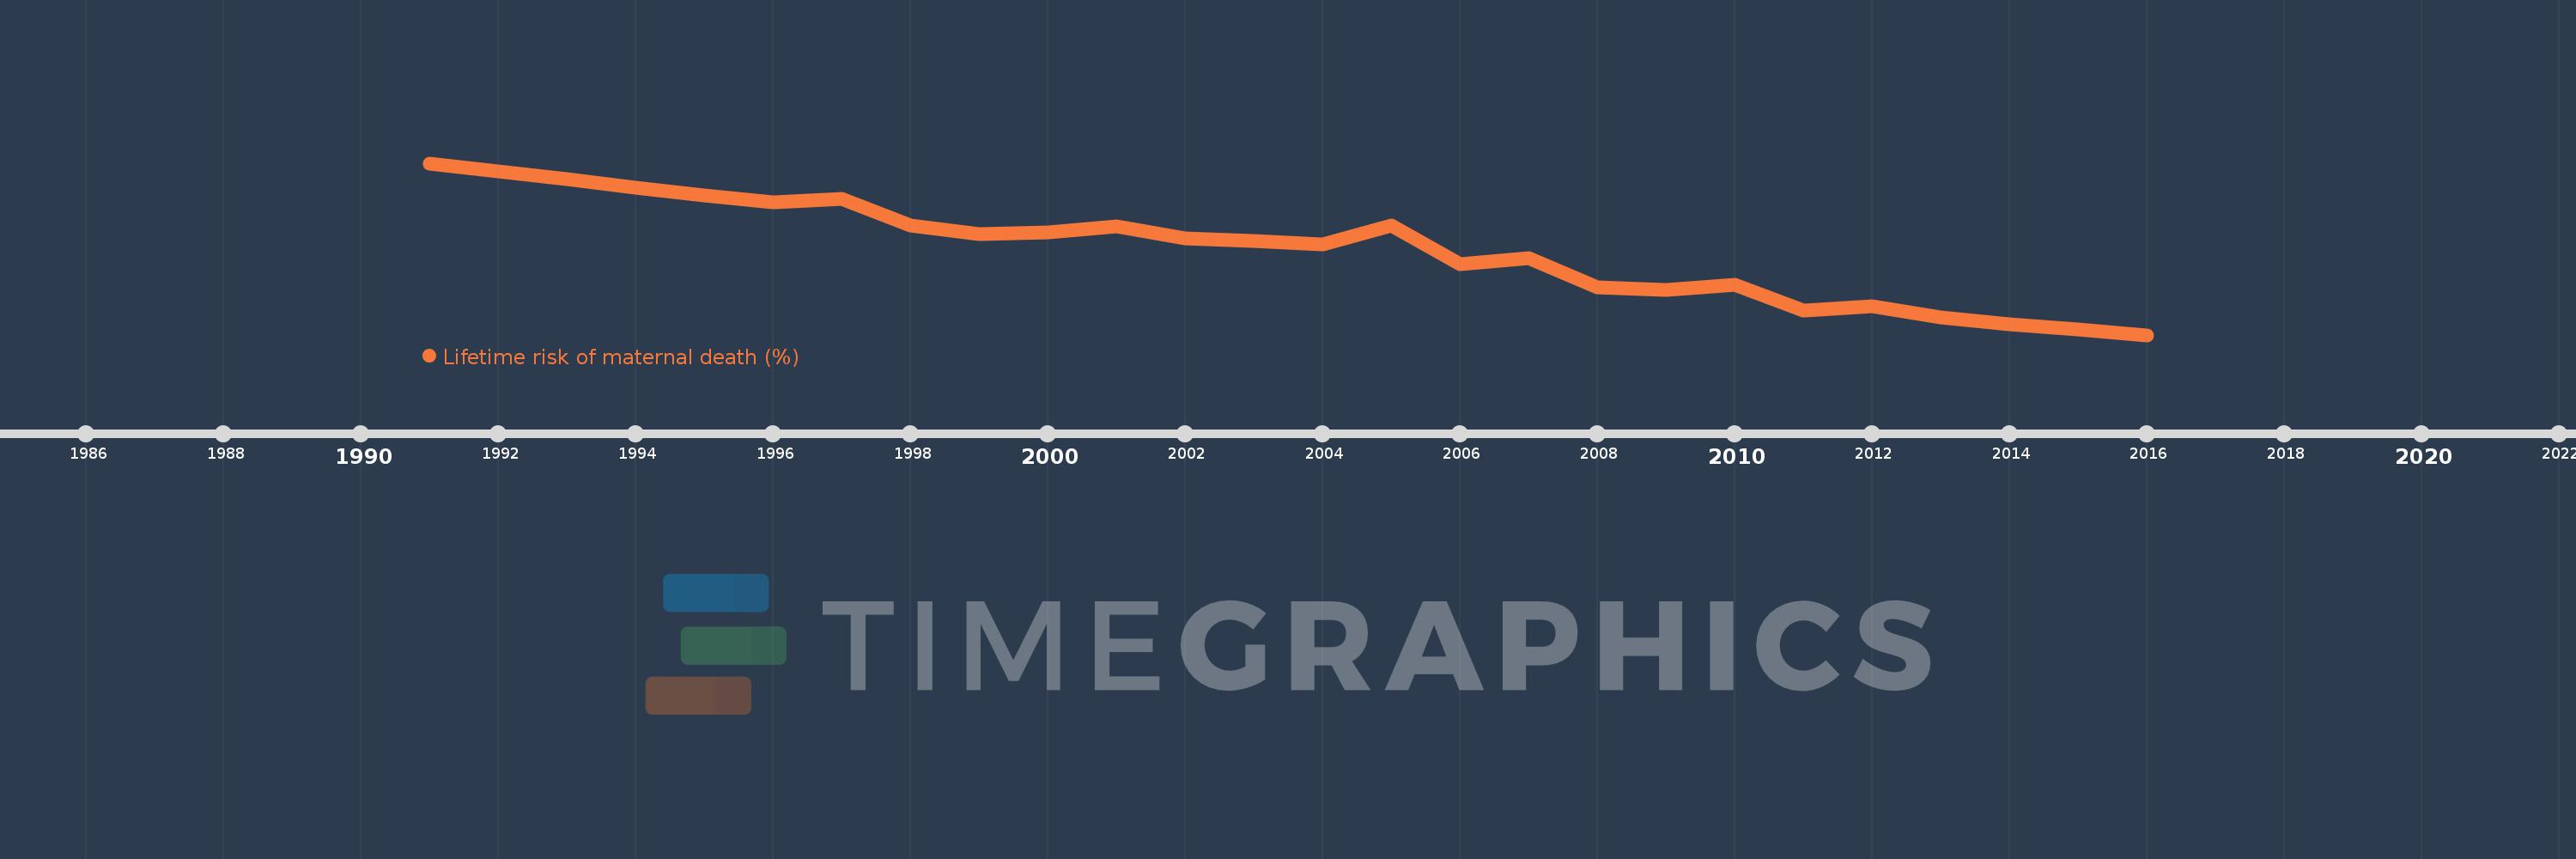
This timeline shows a graph from 1991 to 2016 of Paraguay. No data until 1990. Number of actual observations by date: 26.
Source name:
World Development Indicators
Source organization:
WHO, UNICEF, UNFPA, The World Bank, and the United Nations Population Division. Trends in Maternal Mortality: 1990 to 2015. Geneva, World Health Organization, 2015
Categories, topics:
Health, Gender
Last updated:
apr 23, 2017
Indicators value changes by year
Meaning:
0.557
Minimum:
0.368
jan 1, 2016
Maximum:
0.745
jan 1, 1991
At the date of observation
Value
Absolute change
Change from the previous value
jan 1, 1991
0.745
+0.745
0.0%
jan 1, 1992
0.727
-0.018
-2.42%
jan 1, 1993
0.711
-0.016
-2.22%
jan 1, 1994
0.691
-0.019
-2.73%
jan 1, 1995
0.674
-0.018
-2.54%
jan 1, 1996
0.66
-0.014
-2.08%
jan 1, 1997
0.667
+0.008
1.2%
jan 1, 1998
0.609
-0.059
-8.79%
jan 1, 1999
0.589
-0.02
-3.31%
jan 1, 2000
0.593
+0.005
0.81%
jan 1, 2001
0.607
+0.014
2.37%
jan 1, 2002
0.581
-0.026
-4.33%
jan 1, 2003
0.575
-0.006
-1.08%
jan 1, 2004
0.567
-0.008
-1.37%
jan 1, 2005
0.609
+0.042
7.4%
jan 1, 2006
0.523
-0.086
-14.05%
jan 1, 2007
0.537
+0.013
2.54%
jan 1, 2008
0.473
-0.064
-11.93%
jan 1, 2009
0.467
-0.005
-1.15%
jan 1, 2010
0.478
+0.01
2.24%
jan 1, 2011
0.422
-0.056
-11.67%
jan 1, 2012
0.431
+0.009
2.15%
jan 1, 2013
0.406
-0.025
-5.81%
jan 1, 2014
0.391
-0.015
-3.63%
jan 1, 2015
0.38
-0.011
-2.81%
jan 1, 2016
0.368
-0.012
-3.14%
Ranking of countries by current statistics by years