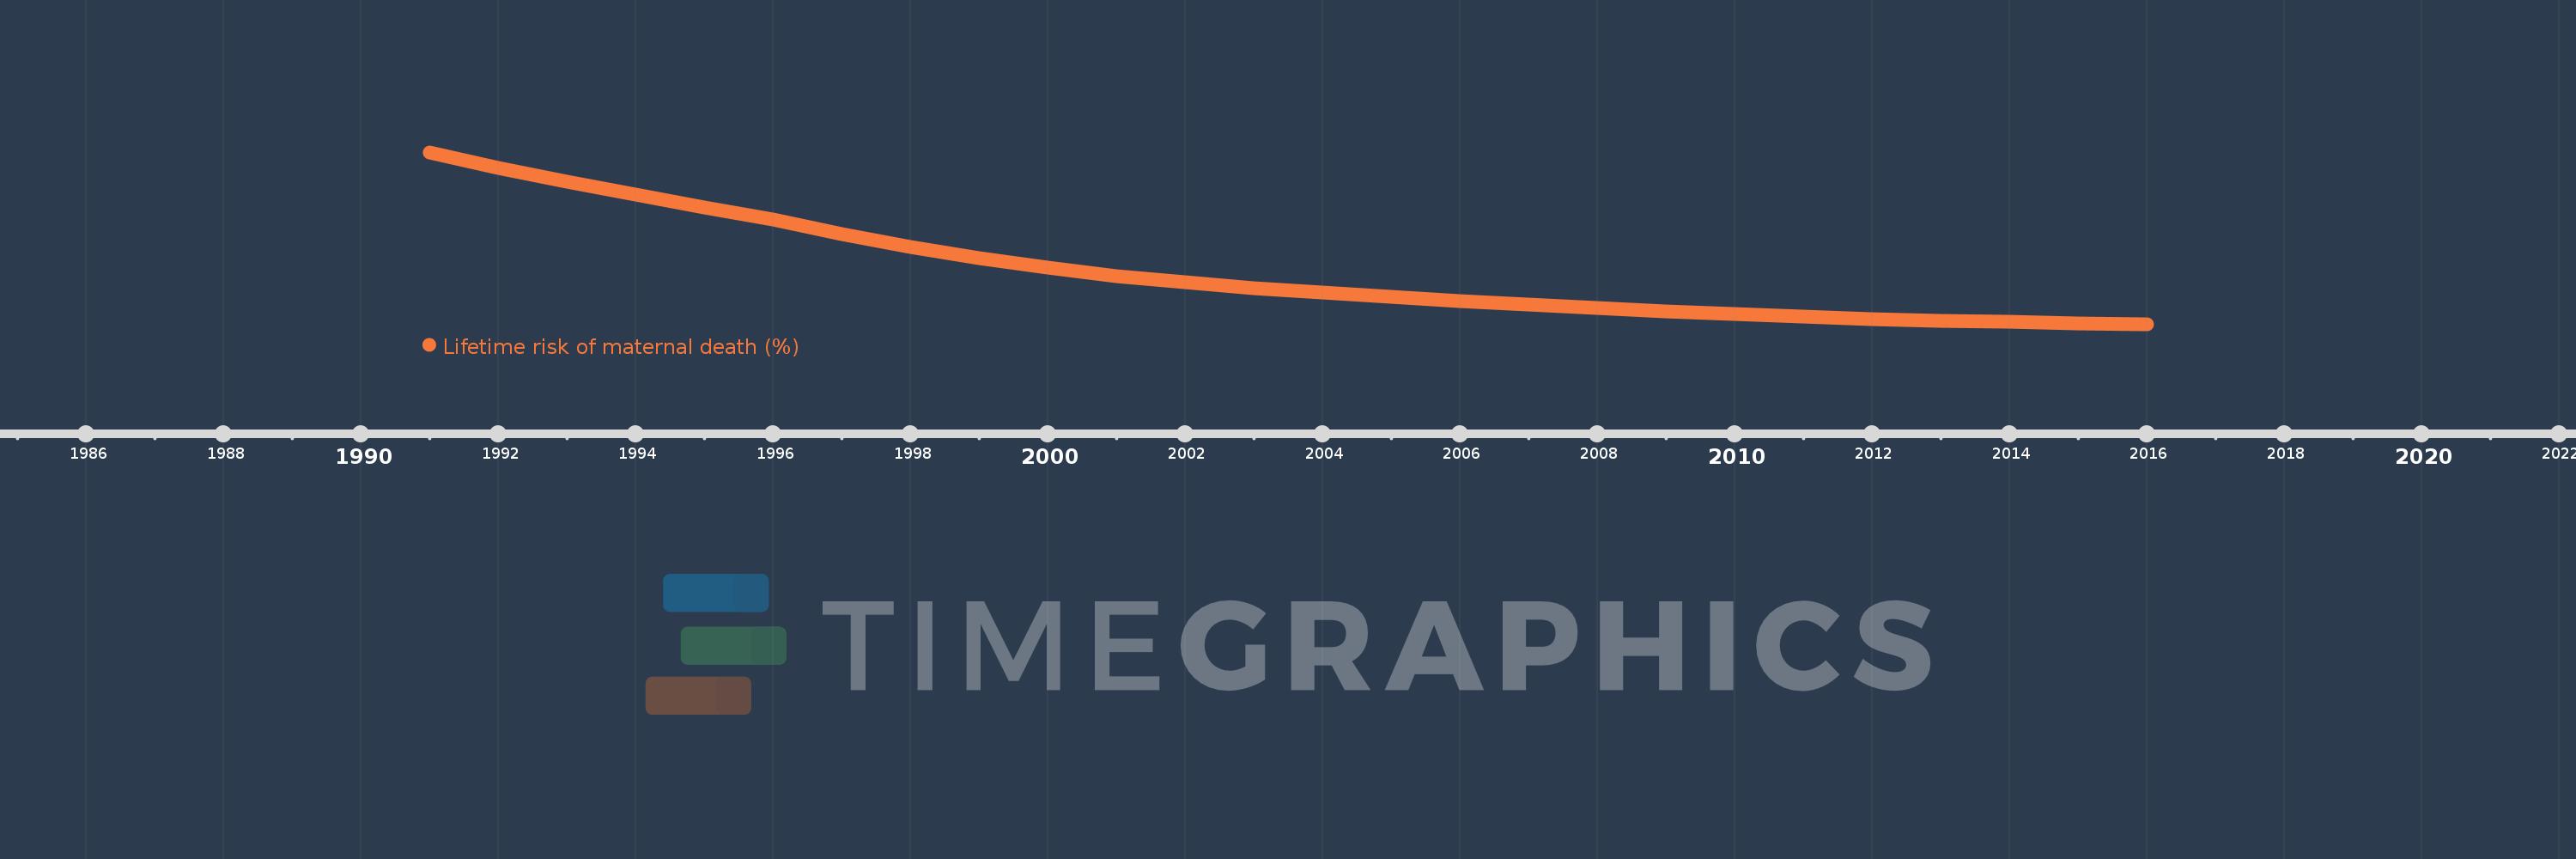
This timeline shows a graph from 1991 to 2016 of Bhutan. No data until 1990. Number of actual observations by date: 26.
Source name:
World Development Indicators
Source organization:
WHO, UNICEF, UNFPA, The World Bank, and the United Nations Population Division. Trends in Maternal Mortality: 1990 to 2015. Geneva, World Health Organization, 2015
Categories, topics:
Health, Gender
Last updated:
apr 23, 2017
Indicators value changes by year
Meaning:
1.771
Minimum:
0.325
jan 1, 2016
Maximum:
4.94
jan 1, 1991
At the date of observation
Value
Absolute change
Change from the previous value
jan 1, 1991
4.94
+4.94
0.0%
jan 1, 1992
4.528
-0.412
-8.34%
jan 1, 1993
4.16
-0.368
-8.13%
jan 1, 1994
3.805
-0.354
-8.52%
jan 1, 1995
3.466
-0.339
-8.92%
jan 1, 1996
3.142
-0.324
-9.34%
jan 1, 1997
2.747
-0.395
-12.57%
jan 1, 1998
2.395
-0.352
-12.81%
jan 1, 1999
2.088
-0.308
-12.85%
jan 1, 2000
1.836
-0.251
-12.04%
jan 1, 2001
1.614
-0.222
-12.11%
jan 1, 2002
1.448
-0.166
-10.28%
jan 1, 2003
1.302
-0.146
-10.11%
jan 1, 2004
1.179
-0.122
-9.4%
jan 1, 2005
1.065
-0.115
-9.73%
jan 1, 2006
0.956
-0.109
-10.23%
jan 1, 2007
0.855
-0.101
-10.58%
jan 1, 2008
0.761
-0.093
-10.91%
jan 1, 2009
0.676
-0.085
-11.2%
jan 1, 2010
0.594
-0.082
-12.12%
jan 1, 2011
0.527
-0.067
-11.3%
jan 1, 2012
0.471
-0.056
-10.67%
jan 1, 2013
0.423
-0.048
-10.15%
jan 1, 2014
0.383
-0.04
-9.5%
jan 1, 2015
0.351
-0.031
-8.21%
jan 1, 2016
0.325
-0.026
-7.53%
Ranking of countries by current statistics by years