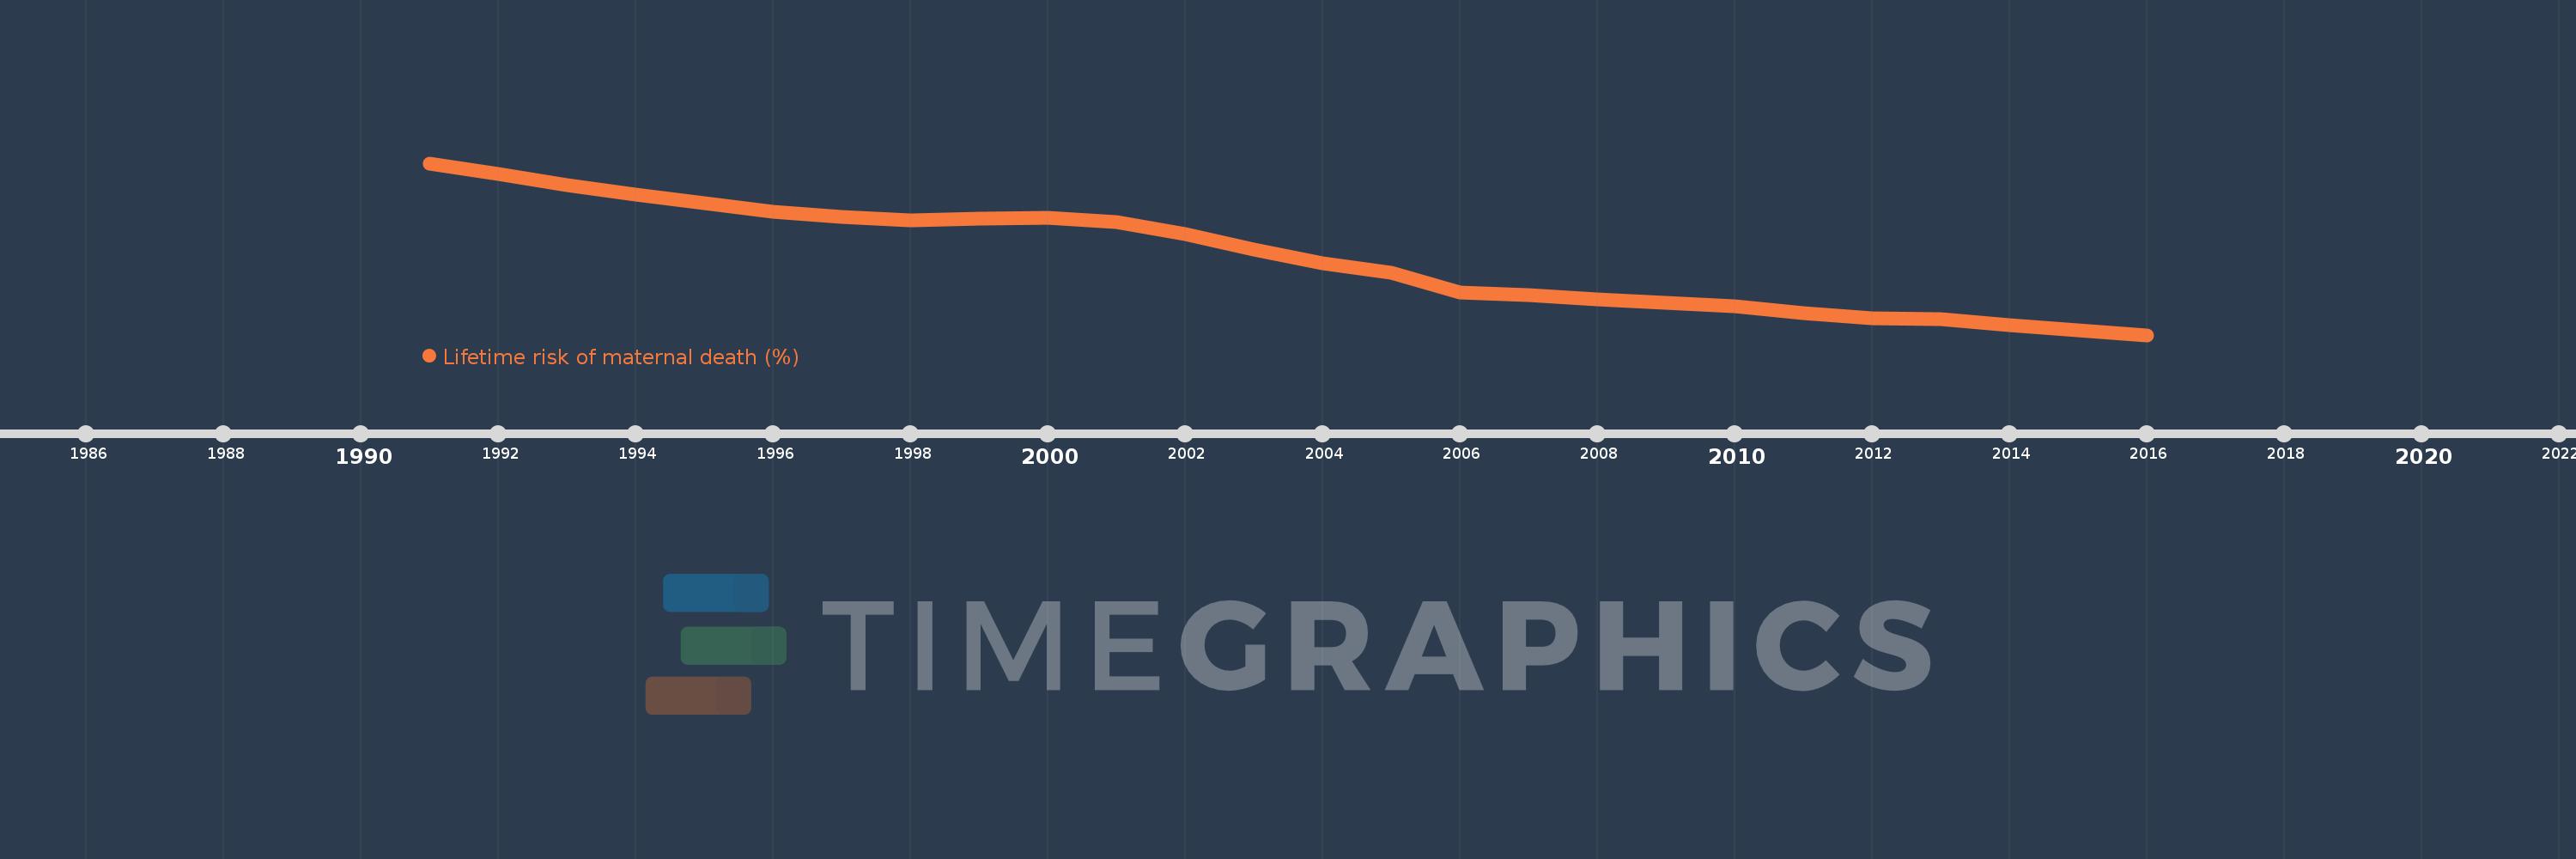
This timeline shows a graph from 1991 to 2016 of Guatemala. No data until 1990. Number of actual observations by date: 26.
Source name:
World Development Indicators
Source organization:
WHO, UNICEF, UNFPA, The World Bank, and the United Nations Population Division. Trends in Maternal Mortality: 1990 to 2015. Geneva, World Health Organization, 2015
Categories, topics:
Health, Gender
Last updated:
apr 23, 2017
Indicators value changes by year
Meaning:
0.696
Minimum:
0.306
jan 1, 2016
Maximum:
1.166
jan 1, 1991
At the date of observation
Value
Absolute change
Change from the previous value
jan 1, 1991
1.166
+1.166
0.0%
jan 1, 1992
1.111
-0.055
-4.72%
jan 1, 1993
1.057
-0.053
-4.8%
jan 1, 1994
1.008
-0.05
-4.68%
jan 1, 1995
0.965
-0.043
-4.29%
jan 1, 1996
0.924
-0.041
-4.21%
jan 1, 1997
0.896
-0.028
-3.02%
jan 1, 1998
0.882
-0.014
-1.56%
jan 1, 1999
0.888
+0.006
0.69%
jan 1, 2000
0.893
+0.004
0.5%
jan 1, 2001
0.87
-0.022
-2.5%
jan 1, 2002
0.81
-0.06
-6.92%
jan 1, 2003
0.733
-0.077
-9.51%
jan 1, 2004
0.663
-0.07
-9.56%
jan 1, 2005
0.618
-0.045
-6.8%
jan 1, 2006
0.521
-0.097
-15.73%
jan 1, 2007
0.506
-0.014
-2.73%
jan 1, 2008
0.483
-0.024
-4.73%
jan 1, 2009
0.468
-0.015
-3.07%
jan 1, 2010
0.448
-0.02
-4.3%
jan 1, 2011
0.415
-0.032
-7.23%
jan 1, 2012
0.388
-0.028
-6.66%
jan 1, 2013
0.387
-0.001
-0.22%
jan 1, 2014
0.357
-0.03
-7.66%
jan 1, 2015
0.331
-0.027
-7.43%
jan 1, 2016
0.306
-0.024
-7.33%
Ranking of countries by current statistics by years