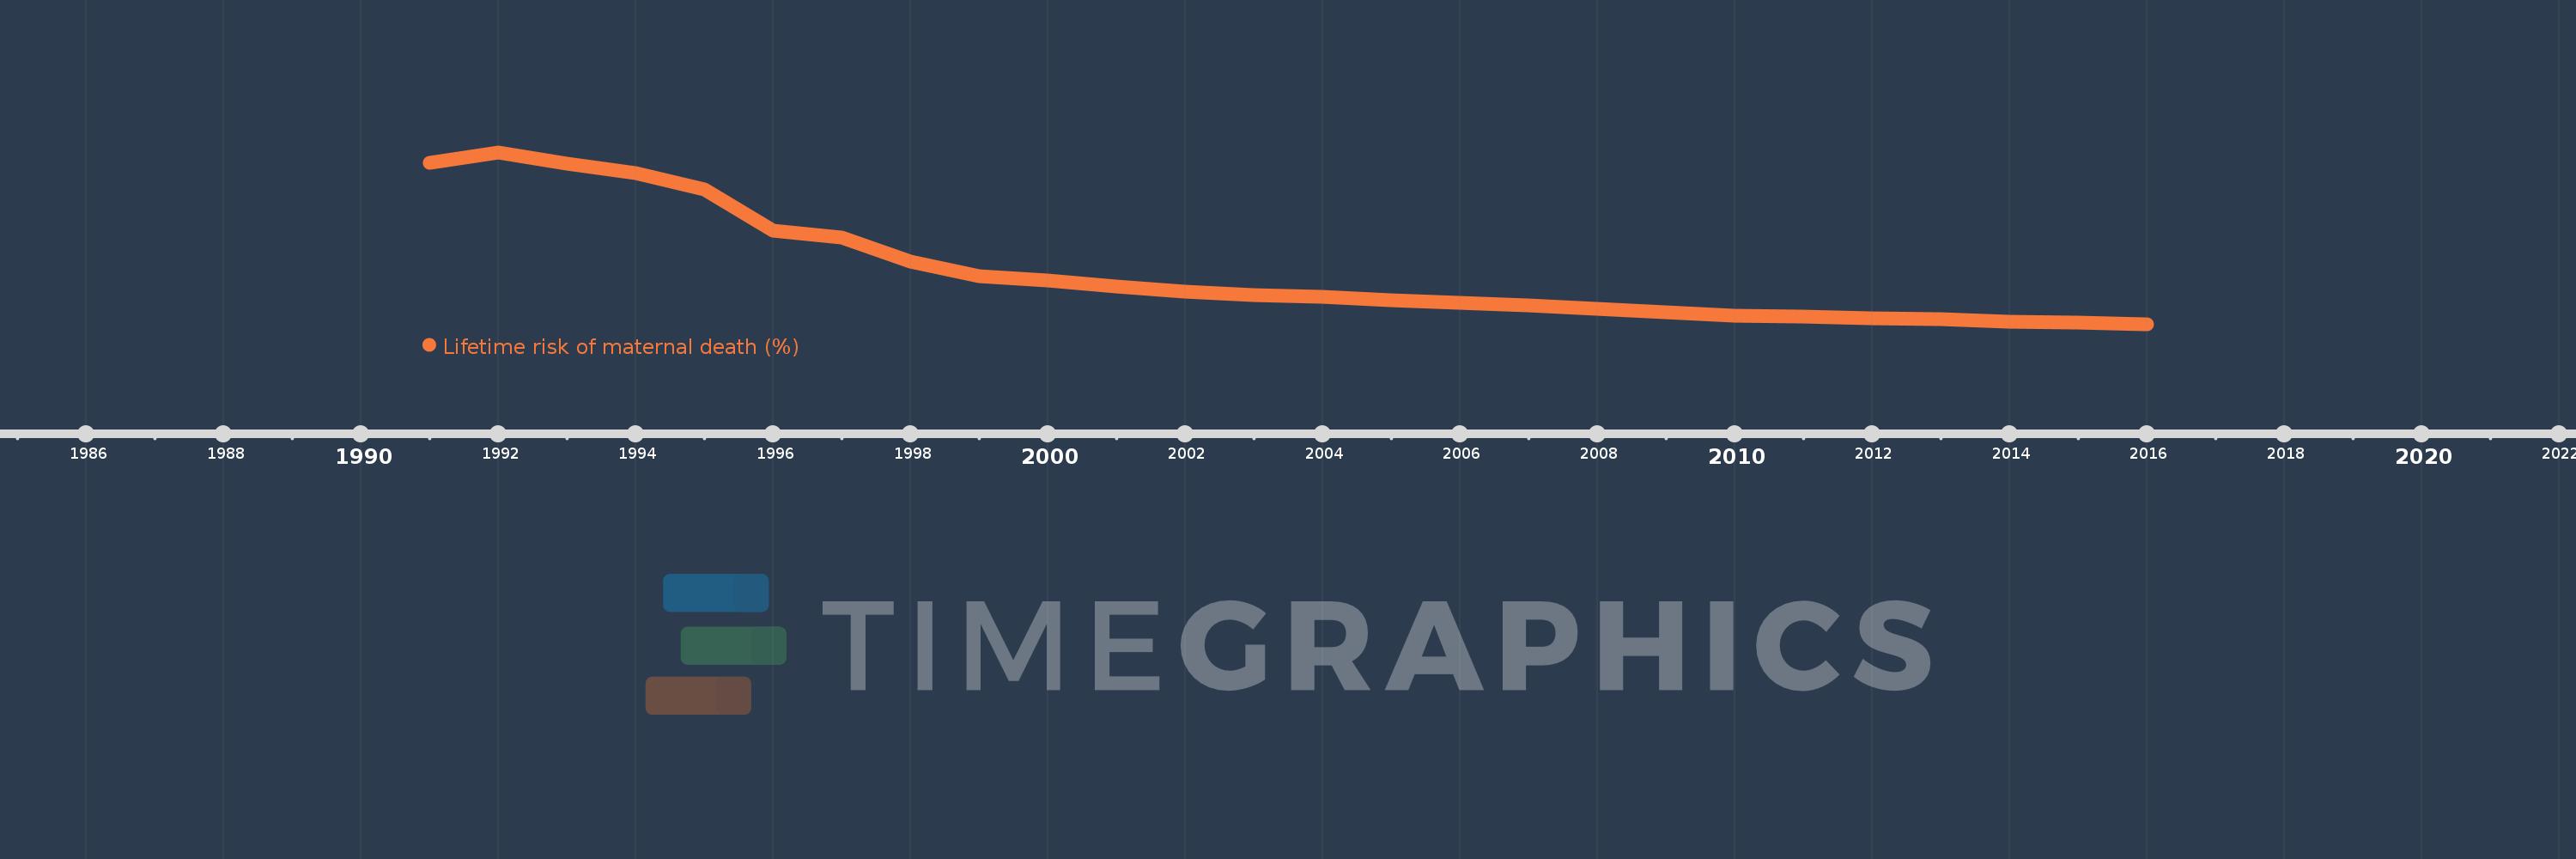
This timeline shows a graph from 1991 to 2016 of Turkmenistan. No data until 1990. Number of actual observations by date: 26.
Source name:
World Development Indicators
Source organization:
WHO, UNICEF, UNFPA, The World Bank, and the United Nations Population Division. Trends in Maternal Mortality: 1990 to 2015. Geneva, World Health Organization, 2015
Categories, topics:
Health, Gender
Last updated:
apr 23, 2017
Indicators value changes by year
Meaning:
0.207
Minimum:
0.106
jan 1, 2016
Maximum:
0.437
jan 1, 1992
At the date of observation
Value
Absolute change
Change from the previous value
jan 1, 1991
0.417
+0.417
0.0%
jan 1, 1992
0.437
+0.02
4.88%
jan 1, 1993
0.416
-0.021
-4.72%
jan 1, 1994
0.397
-0.02
-4.7%
jan 1, 1995
0.365
-0.032
-8.07%
jan 1, 1996
0.287
-0.077
-21.21%
jan 1, 1997
0.273
-0.014
-4.98%
jan 1, 1998
0.226
-0.047
-17.07%
jan 1, 1999
0.198
-0.028
-12.49%
jan 1, 2000
0.19
-0.008
-3.91%
jan 1, 2001
0.178
-0.013
-6.71%
jan 1, 2002
0.169
-0.009
-4.9%
jan 1, 2003
0.162
-0.007
-3.87%
jan 1, 2004
0.159
-0.004
-2.29%
jan 1, 2005
0.153
-0.006
-3.52%
jan 1, 2006
0.147
-0.006
-3.89%
jan 1, 2007
0.142
-0.005
-3.55%
jan 1, 2008
0.135
-0.007
-4.63%
jan 1, 2009
0.129
-0.007
-4.92%
jan 1, 2010
0.123
-0.005
-4.16%
jan 1, 2011
0.12
-0.004
-3.0%
jan 1, 2012
0.117
-0.002
-2.06%
jan 1, 2013
0.115
-0.002
-1.92%
jan 1, 2014
0.111
-0.004
-3.05%
jan 1, 2015
0.109
-0.002
-2.12%
jan 1, 2016
0.106
-0.003
-2.9%
Ranking of countries by current statistics by years