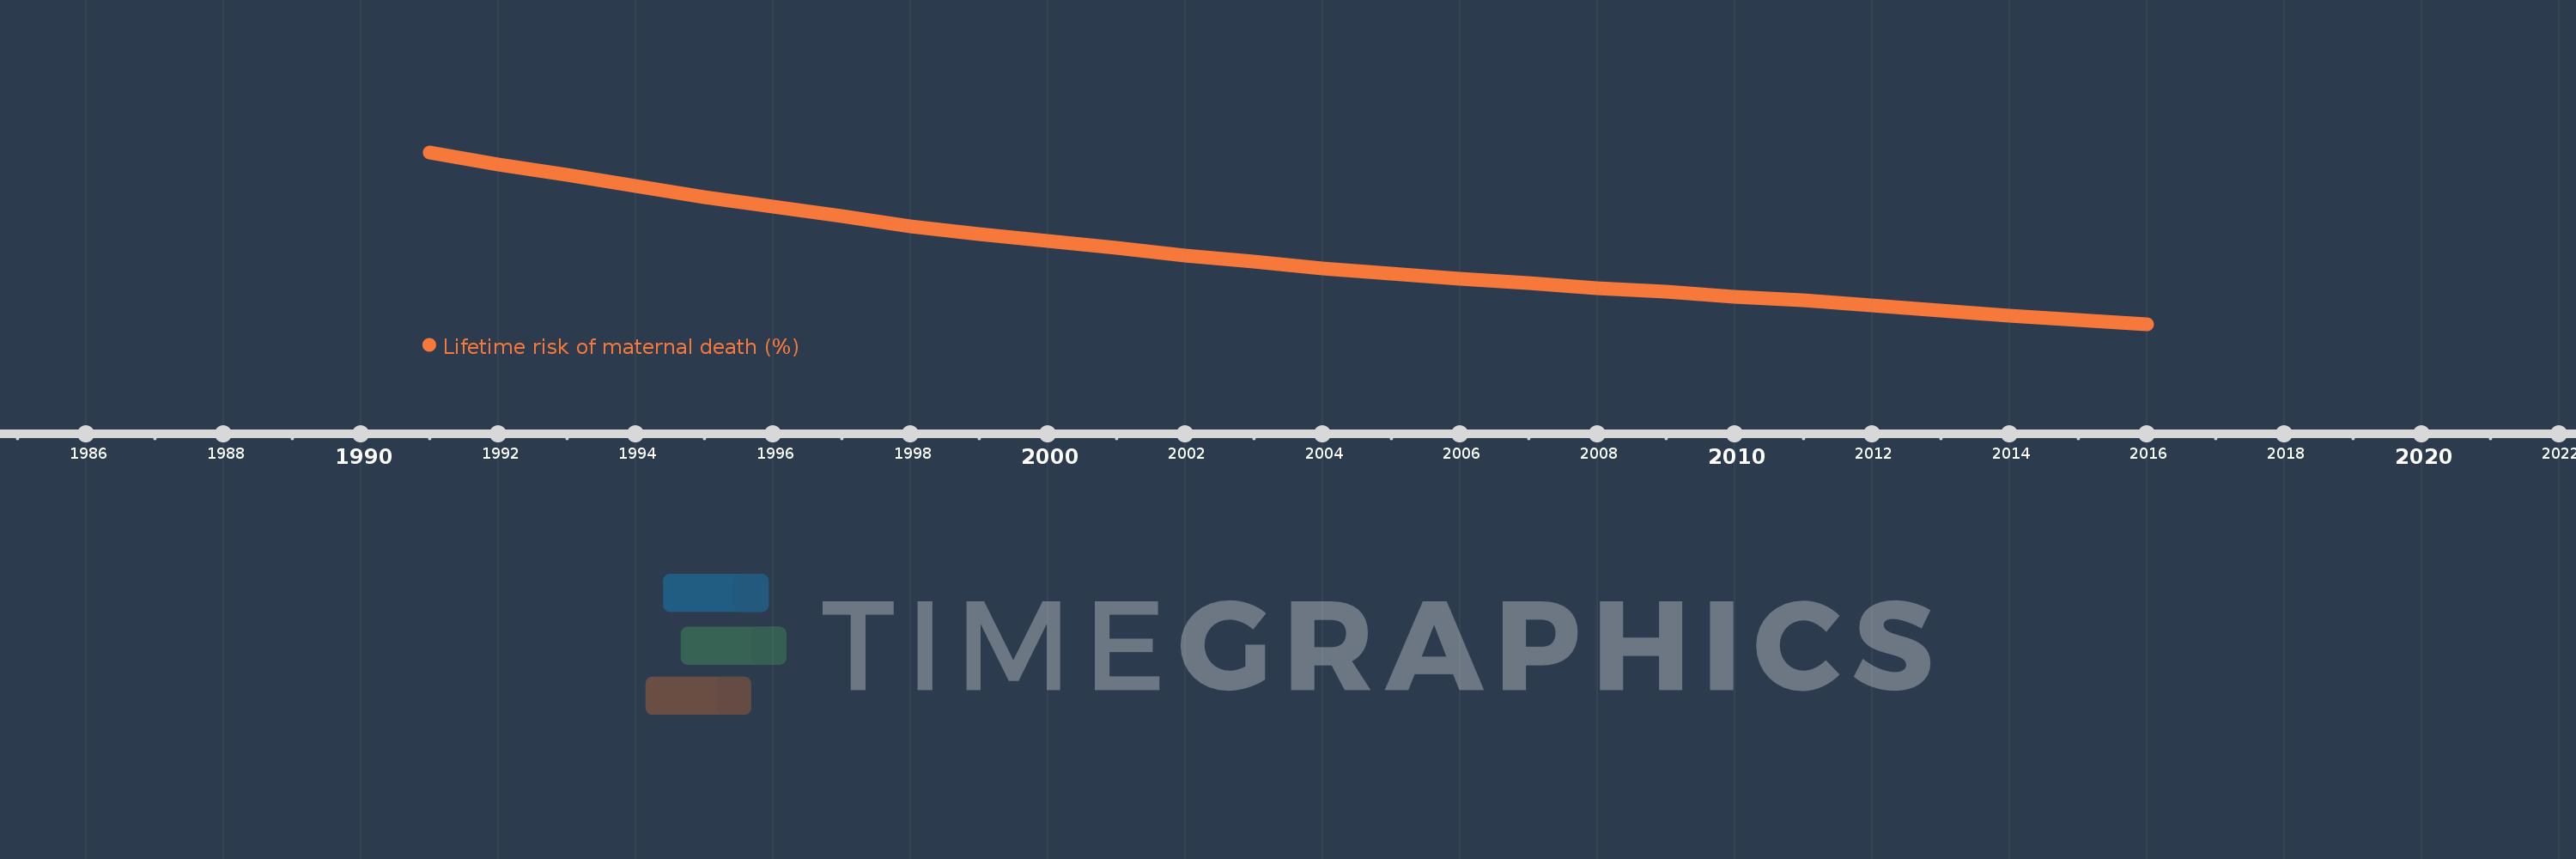
This timeline shows a graph from 1991 to 2016 of Comoros. No data until 1990. Number of actual observations by date: 26.
Source name:
World Development Indicators
Source organization:
WHO, UNICEF, UNFPA, The World Bank, and the United Nations Population Division. Trends in Maternal Mortality: 1990 to 2015. Geneva, World Health Organization, 2015
Categories, topics:
Health, Gender
Last updated:
apr 23, 2017
Indicators value changes by year
Meaning:
2.534
Minimum:
1.517
jan 1, 2016
Maximum:
4.029
jan 1, 1991
At the date of observation
Value
Absolute change
Change from the previous value
jan 1, 1991
4.029
+4.029
0.0%
jan 1, 1992
3.855
-0.174
-4.31%
jan 1, 1993
3.696
-0.159
-4.12%
jan 1, 1994
3.54
-0.156
-4.21%
jan 1, 1995
3.376
-0.164
-4.64%
jan 1, 1996
3.239
-0.137
-4.07%
jan 1, 1997
3.096
-0.142
-4.4%
jan 1, 1998
2.947
-0.149
-4.82%
jan 1, 1999
2.832
-0.115
-3.9%
jan 1, 2000
2.729
-0.103
-3.63%
jan 1, 2001
2.632
-0.097
-3.55%
jan 1, 2002
2.524
-0.109
-4.13%
jan 1, 2003
2.43
-0.094
-3.71%
jan 1, 2004
2.333
-0.097
-3.98%
jan 1, 2005
2.257
-0.077
-3.29%
jan 1, 2006
2.179
-0.078
-3.45%
jan 1, 2007
2.113
-0.066
-3.03%
jan 1, 2008
2.042
-0.07
-3.34%
jan 1, 2009
1.987
-0.055
-2.68%
jan 1, 2010
1.92
-0.068
-3.4%
jan 1, 2011
1.863
-0.057
-2.98%
jan 1, 2012
1.792
-0.071
-3.8%
jan 1, 2013
1.719
-0.072
-4.05%
jan 1, 2014
1.647
-0.073
-4.23%
jan 1, 2015
1.581
-0.065
-3.97%
jan 1, 2016
1.517
-0.064
-4.04%
Ranking of countries by current statistics by years