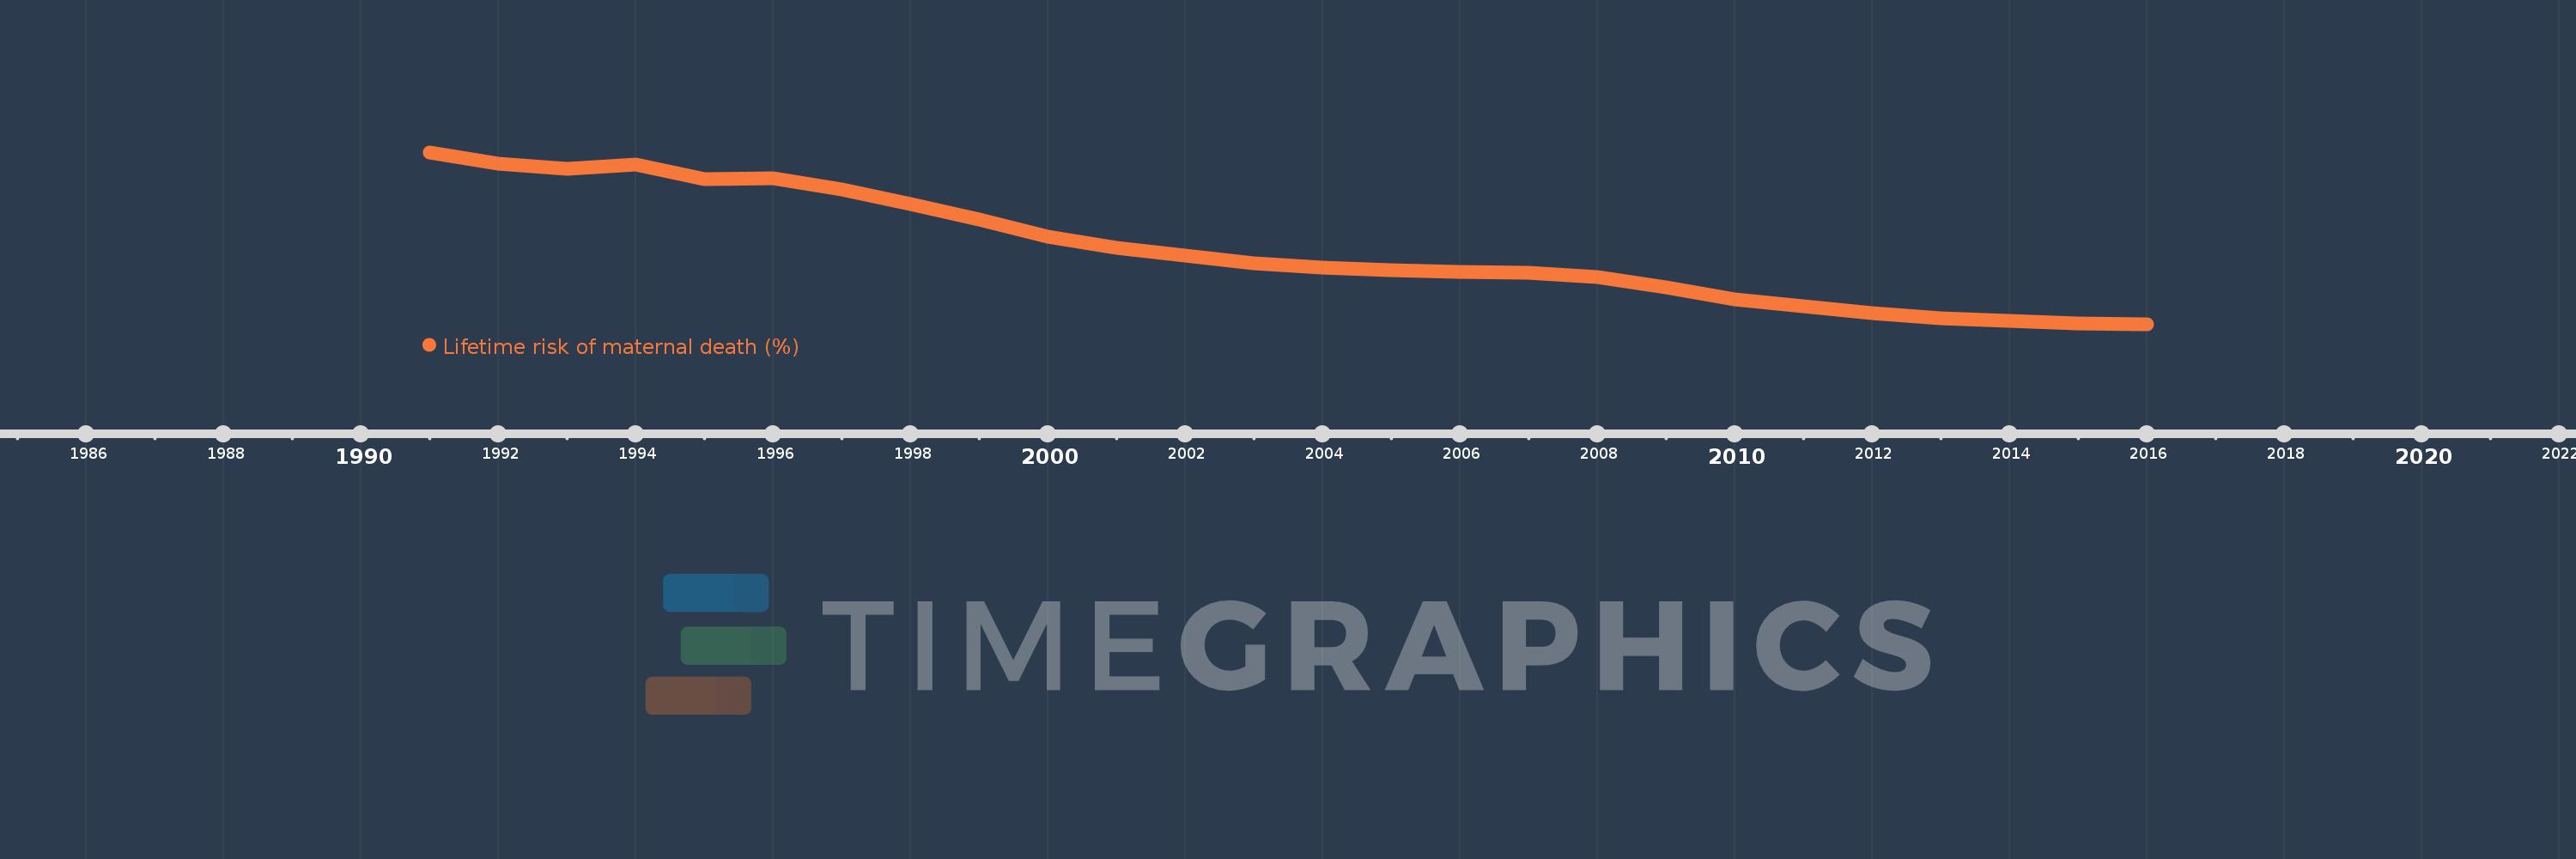
This timeline shows a graph from 1991 to 2016 of Kazakhstan. No data until 1990. Number of actual observations by date: 26.
Source name:
World Development Indicators
Source organization:
WHO, UNICEF, UNFPA, The World Bank, and the United Nations Population Division. Trends in Maternal Mortality: 1990 to 2015. Geneva, World Health Organization, 2015
Categories, topics:
Health, Gender
Last updated:
apr 23, 2017
Indicators value changes by year
Meaning:
0.127
Minimum:
0.034
jan 1, 2016
Maximum:
0.246
jan 1, 1991
At the date of observation
Value
Absolute change
Change from the previous value
jan 1, 1991
0.246
+0.246
0.0%
jan 1, 1992
0.232
-0.014
-5.74%
jan 1, 1993
0.226
-0.006
-2.57%
jan 1, 1994
0.231
+0.004
1.86%
jan 1, 1995
0.213
-0.017
-7.54%
jan 1, 1996
0.214
+0.0
0.2%
jan 1, 1997
0.2
-0.013
-6.18%
jan 1, 1998
0.182
-0.018
-8.93%
jan 1, 1999
0.163
-0.019
-10.41%
jan 1, 2000
0.142
-0.021
-12.98%
jan 1, 2001
0.128
-0.014
-9.81%
jan 1, 2002
0.119
-0.009
-7.22%
jan 1, 2003
0.109
-0.01
-8.46%
jan 1, 2004
0.104
-0.005
-4.54%
jan 1, 2005
0.101
-0.003
-2.77%
jan 1, 2006
0.099
-0.002
-1.84%
jan 1, 2007
0.098
-0.001
-0.88%
jan 1, 2008
0.092
-0.006
-6.06%
jan 1, 2009
0.079
-0.013
-14.28%
jan 1, 2010
0.065
-0.015
-18.41%
jan 1, 2011
0.056
-0.009
-13.68%
jan 1, 2012
0.048
-0.008
-14.88%
jan 1, 2013
0.041
-0.006
-13.08%
jan 1, 2014
0.038
-0.004
-8.56%
jan 1, 2015
0.035
-0.002
-6.4%
jan 1, 2016
0.034
-0.002
-4.66%
Ranking of countries by current statistics by years