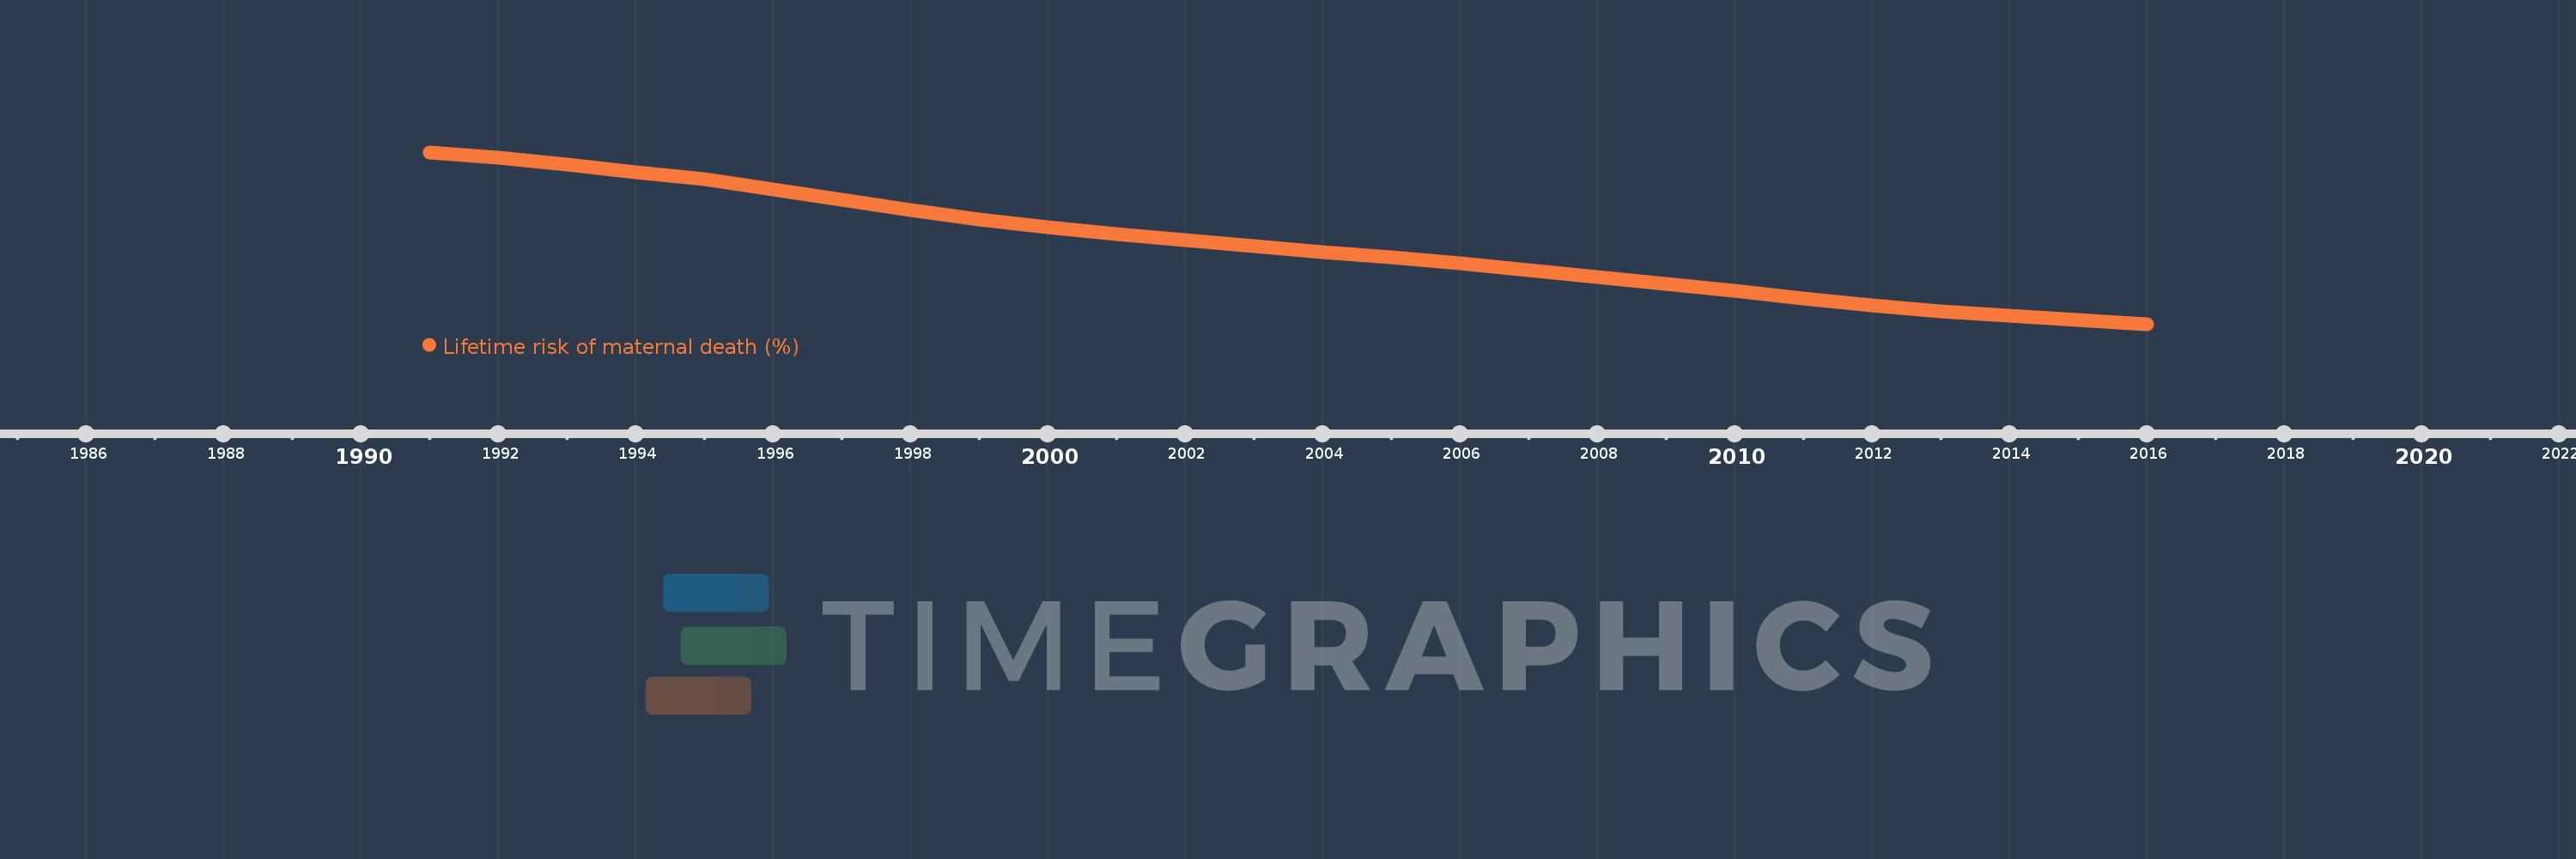
This timeline shows a graph from 1991 to 2016 of Bolivia. No data until 1990. Number of actual observations by date: 26.
Source name:
World Development Indicators
Source organization:
WHO, UNICEF, UNFPA, The World Bank, and the United Nations Population Division. Trends in Maternal Mortality: 1990 to 2015. Geneva, World Health Organization, 2015
Categories, topics:
Health, Gender
Last updated:
apr 23, 2017
Indicators value changes by year
Meaning:
1.335
Minimum:
0.644
jan 1, 2016
Maximum:
2.138
jan 1, 1991
At the date of observation
Value
Absolute change
Change from the previous value
jan 1, 1991
2.138
+2.138
0.0%
jan 1, 1992
2.091
-0.047
-2.21%
jan 1, 1993
2.034
-0.056
-2.7%
jan 1, 1994
1.969
-0.065
-3.21%
jan 1, 1995
1.902
-0.067
-3.42%
jan 1, 1996
1.819
-0.083
-4.38%
jan 1, 1997
1.723
-0.096
-5.27%
jan 1, 1998
1.635
-0.087
-5.08%
jan 1, 1999
1.551
-0.084
-5.13%
jan 1, 2000
1.484
-0.067
-4.32%
jan 1, 2001
1.424
-0.061
-4.11%
jan 1, 2002
1.373
-0.05
-3.52%
jan 1, 2003
1.323
-0.051
-3.69%
jan 1, 2004
1.27
-0.052
-3.95%
jan 1, 2005
1.223
-0.048
-3.74%
jan 1, 2006
1.17
-0.052
-4.29%
jan 1, 2007
1.117
-0.053
-4.54%
jan 1, 2008
1.057
-0.06
-5.4%
jan 1, 2009
0.993
-0.064
-6.05%
jan 1, 2010
0.932
-0.061
-6.17%
jan 1, 2011
0.869
-0.062
-6.69%
jan 1, 2012
0.809
-0.06
-6.91%
jan 1, 2013
0.757
-0.053
-6.52%
jan 1, 2014
0.718
-0.038
-5.09%
jan 1, 2015
0.681
-0.037
-5.16%
jan 1, 2016
0.644
-0.037
-5.44%
Ranking of countries by current statistics by years