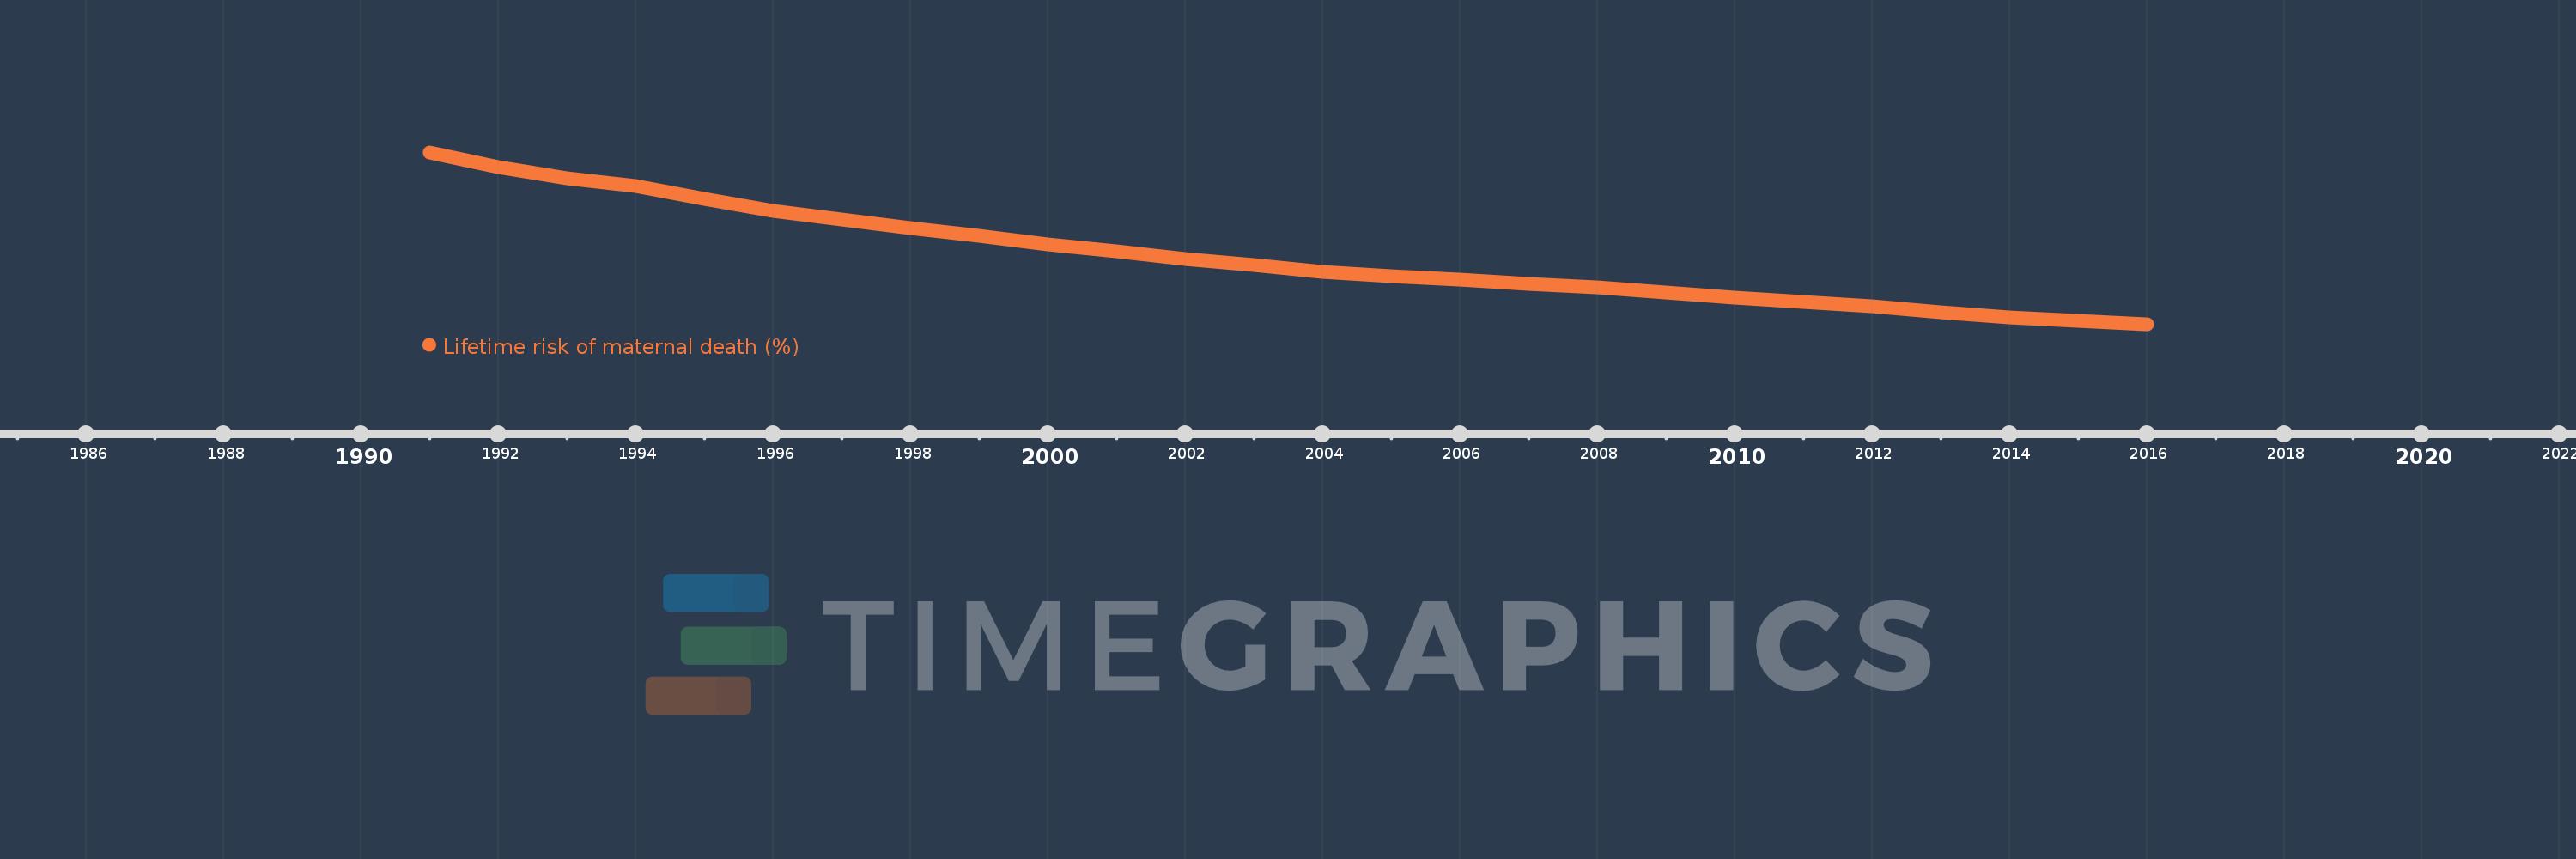
This timeline shows a graph from 1991 to 2016 of Mozambique. No data until 1990. Number of actual observations by date: 26.
Source name:
World Development Indicators
Source organization:
WHO, UNICEF, UNFPA, The World Bank, and the United Nations Population Division. Trends in Maternal Mortality: 1990 to 2015. Geneva, World Health Organization, 2015
Categories, topics:
Health, Gender
Last updated:
apr 23, 2017
Indicators value changes by year
Meaning:
5.043
Minimum:
2.531
jan 1, 2016
Maximum:
8.896
jan 1, 1991
At the date of observation
Value
Absolute change
Change from the previous value
jan 1, 1991
8.896
+8.896
0.0%
jan 1, 1992
8.347
-0.549
-6.18%
jan 1, 1993
7.953
-0.393
-4.71%
jan 1, 1994
7.646
-0.307
-3.86%
jan 1, 1995
7.168
-0.478
-6.25%
jan 1, 1996
6.729
-0.439
-6.13%
jan 1, 1997
6.421
-0.308
-4.58%
jan 1, 1998
6.105
-0.315
-4.91%
jan 1, 1999
5.809
-0.296
-4.85%
jan 1, 2000
5.502
-0.307
-5.28%
jan 1, 2001
5.22
-0.282
-5.13%
jan 1, 2002
4.96
-0.26
-4.98%
jan 1, 2003
4.725
-0.235
-4.74%
jan 1, 2004
4.482
-0.242
-5.13%
jan 1, 2005
4.322
-0.161
-3.58%
jan 1, 2006
4.168
-0.153
-3.55%
jan 1, 2007
4.036
-0.132
-3.17%
jan 1, 2008
3.891
-0.145
-3.59%
jan 1, 2009
3.714
-0.177
-4.55%
jan 1, 2010
3.518
-0.196
-5.27%
jan 1, 2011
3.344
-0.174
-4.95%
jan 1, 2012
3.182
-0.162
-4.84%
jan 1, 2013
2.987
-0.195
-6.13%
jan 1, 2014
2.795
-0.193
-6.45%
jan 1, 2015
2.654
-0.141
-5.04%
jan 1, 2016
2.531
-0.123
-4.63%
Ranking of countries by current statistics by years