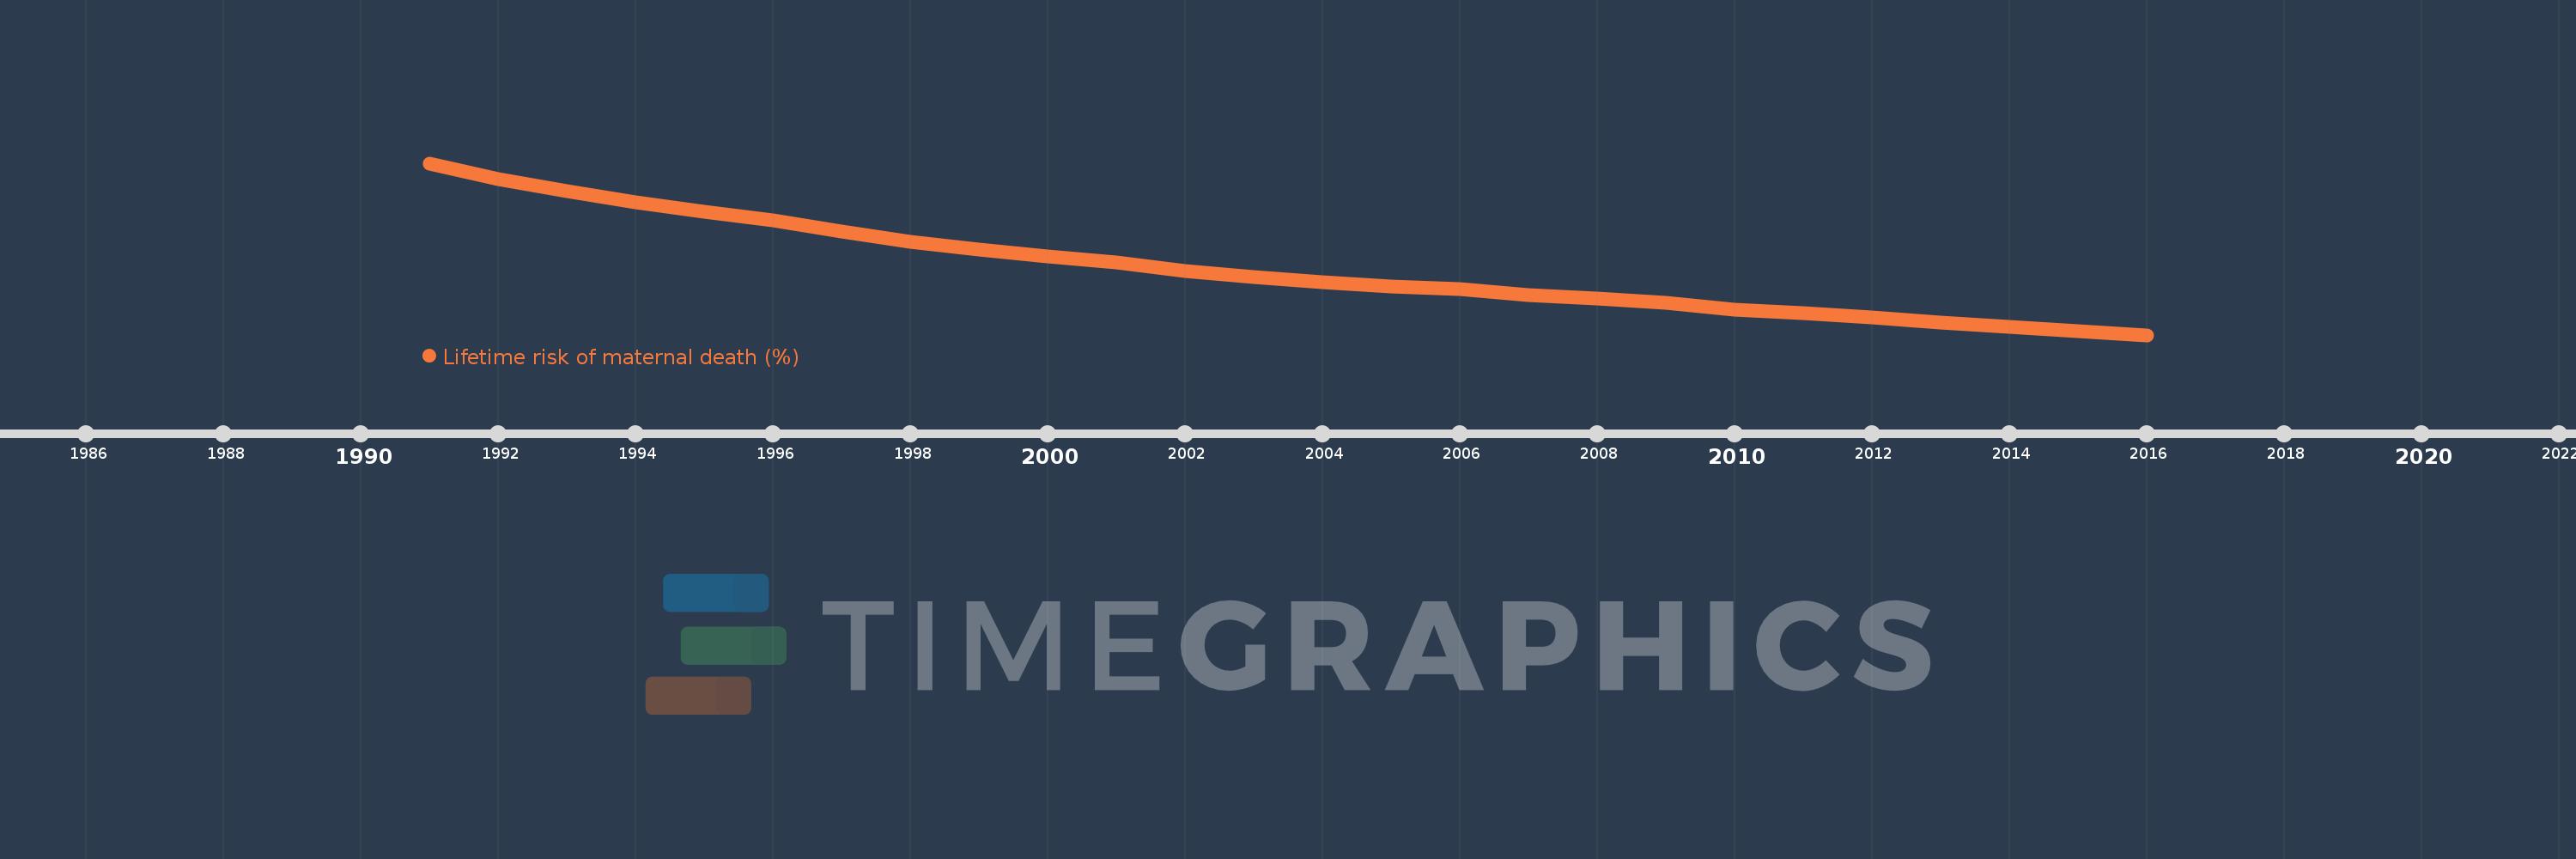
This timeline shows a graph from 1991 to 2016 of Samoa. No data until 1990. Number of actual observations by date: 26.
Source name:
World Development Indicators
Source organization:
WHO, UNICEF, UNFPA, The World Bank, and the United Nations Population Division. Trends in Maternal Mortality: 1990 to 2015. Geneva, World Health Organization, 2015
Categories, topics:
Health, Gender
Last updated:
apr 23, 2017
Indicators value changes by year
Meaning:
0.418
Minimum:
0.199
jan 1, 2016
Maximum:
0.761
jan 1, 1991
At the date of observation
Value
Absolute change
Change from the previous value
jan 1, 1991
0.761
+0.761
0.0%
jan 1, 1992
0.709
-0.052
-6.82%
jan 1, 1993
0.671
-0.039
-5.44%
jan 1, 1994
0.634
-0.037
-5.46%
jan 1, 1995
0.601
-0.033
-5.14%
jan 1, 1996
0.573
-0.029
-4.79%
jan 1, 1997
0.539
-0.034
-5.91%
jan 1, 1998
0.504
-0.034
-6.4%
jan 1, 1999
0.478
-0.026
-5.22%
jan 1, 2000
0.457
-0.021
-4.48%
jan 1, 2001
0.437
-0.02
-4.37%
jan 1, 2002
0.408
-0.028
-6.45%
jan 1, 2003
0.388
-0.021
-5.02%
jan 1, 2004
0.371
-0.017
-4.26%
jan 1, 2005
0.359
-0.012
-3.33%
jan 1, 2006
0.348
-0.011
-3.18%
jan 1, 2007
0.331
-0.016
-4.72%
jan 1, 2008
0.318
-0.013
-4.05%
jan 1, 2009
0.303
-0.015
-4.67%
jan 1, 2010
0.283
-0.02
-6.49%
jan 1, 2011
0.27
-0.013
-4.64%
jan 1, 2012
0.256
-0.014
-5.1%
jan 1, 2013
0.241
-0.016
-6.08%
jan 1, 2014
0.226
-0.014
-5.99%
jan 1, 2015
0.211
-0.015
-6.71%
jan 1, 2016
0.199
-0.012
-5.58%
Ranking of countries by current statistics by years