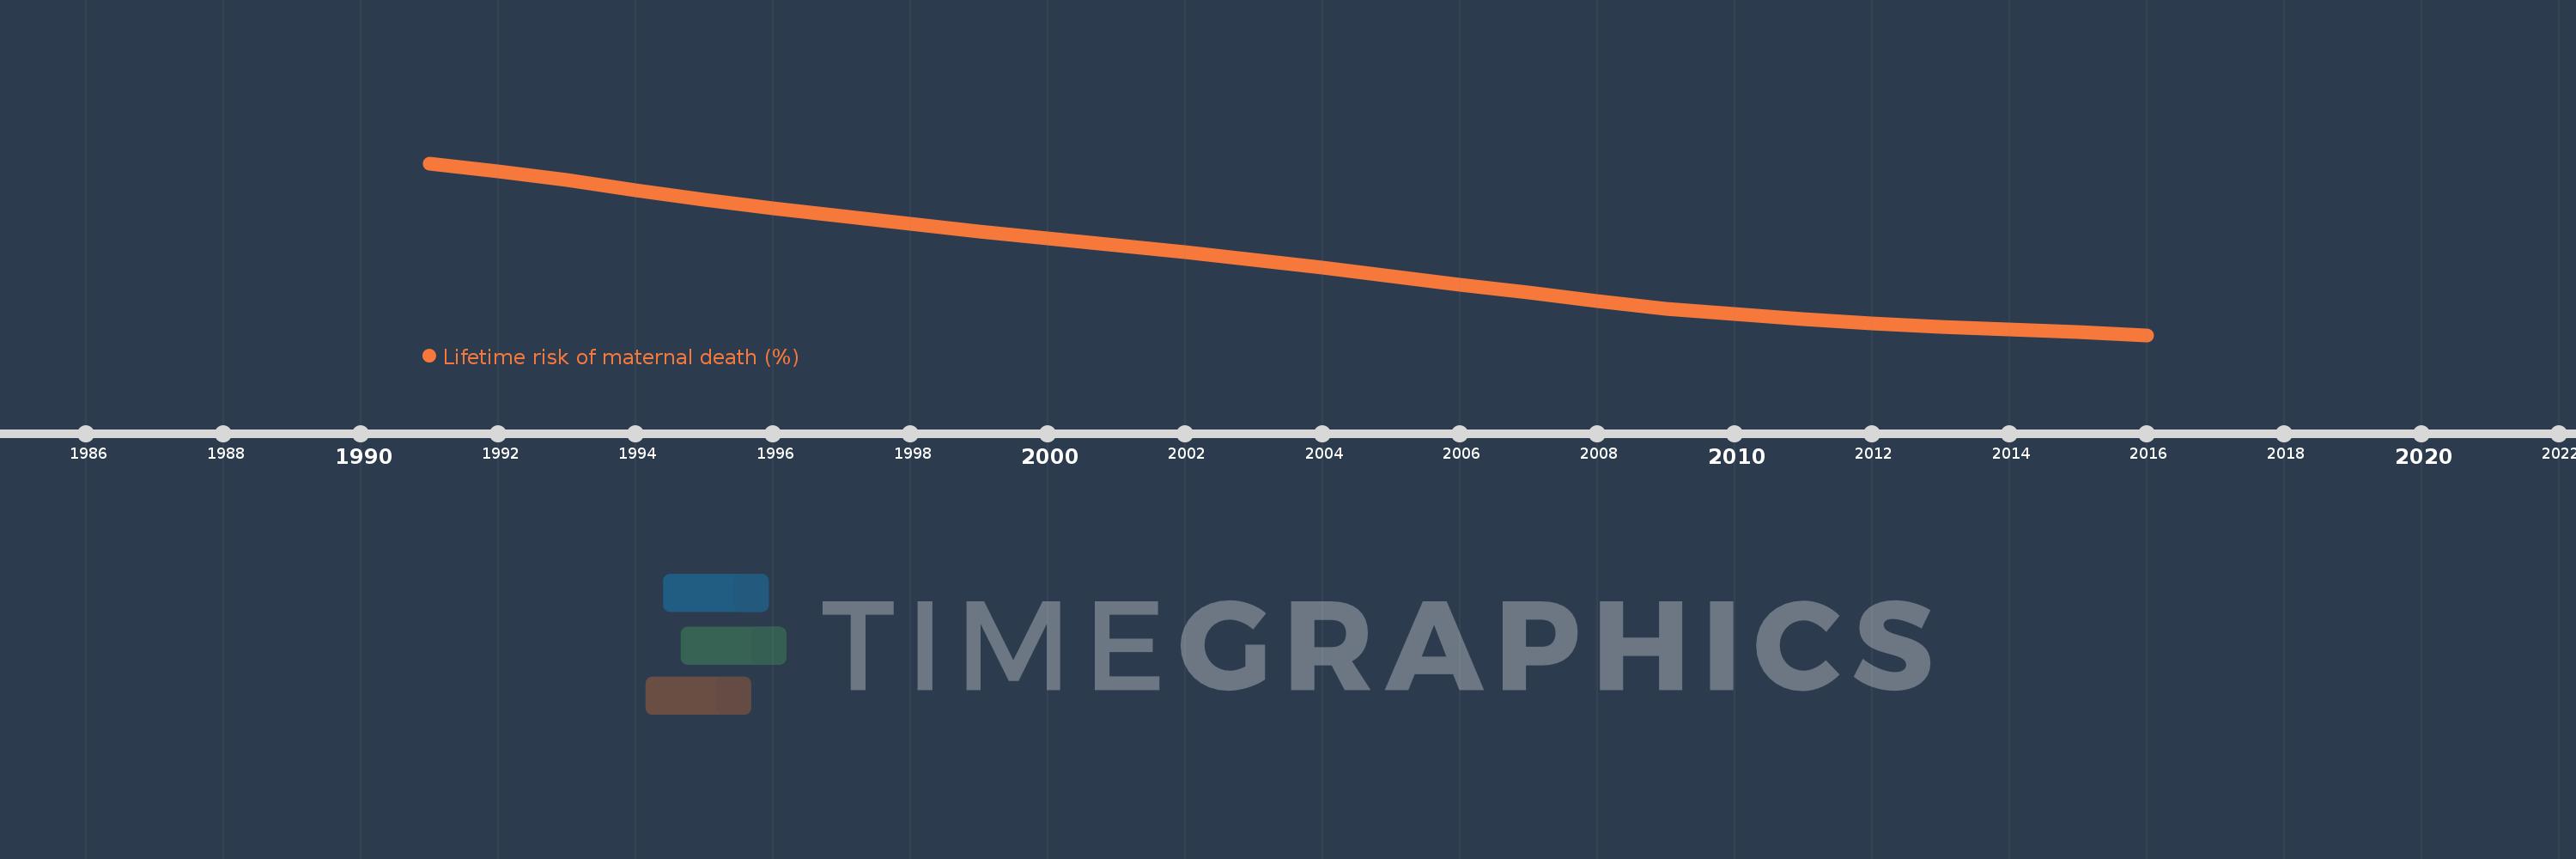
This timeline shows a graph from 1991 to 2016 of Sudan. No data until 1990. Number of actual observations by date: 26.
Source name:
World Development Indicators
Source organization:
WHO, UNICEF, UNFPA, The World Bank, and the United Nations Population Division. Trends in Maternal Mortality: 1990 to 2015. Geneva, World Health Organization, 2015
Categories, topics:
Health, Gender
Last updated:
apr 23, 2017
Indicators value changes by year
Meaning:
2.749
Minimum:
1.389
jan 1, 2016
Maximum:
4.551
jan 1, 1991
At the date of observation
Value
Absolute change
Change from the previous value
jan 1, 1991
4.551
+4.551
0.0%
jan 1, 1992
4.396
-0.155
-3.41%
jan 1, 1993
4.247
-0.149
-3.39%
jan 1, 1994
4.056
-0.191
-4.49%
jan 1, 1995
3.876
-0.18
-4.44%
jan 1, 1996
3.717
-0.159
-4.1%
jan 1, 1997
3.575
-0.142
-3.82%
jan 1, 1998
3.436
-0.14
-3.9%
jan 1, 1999
3.297
-0.139
-4.05%
jan 1, 2000
3.175
-0.122
-3.7%
jan 1, 2001
3.048
-0.127
-4.0%
jan 1, 2002
2.911
-0.137
-4.48%
jan 1, 2003
2.772
-0.139
-4.78%
jan 1, 2004
2.637
-0.135
-4.86%
jan 1, 2005
2.474
-0.163
-6.2%
jan 1, 2006
2.319
-0.154
-6.23%
jan 1, 2007
2.166
-0.154
-6.62%
jan 1, 2008
2.013
-0.153
-7.07%
jan 1, 2009
1.879
-0.134
-6.67%
jan 1, 2010
1.769
-0.109
-5.81%
jan 1, 2011
1.683
-0.086
-4.88%
jan 1, 2012
1.607
-0.076
-4.51%
jan 1, 2013
1.543
-0.064
-3.99%
jan 1, 2014
1.497
-0.046
-3.01%
jan 1, 2015
1.443
-0.054
-3.62%
jan 1, 2016
1.389
-0.054
-3.72%
Ranking of countries by current statistics by years