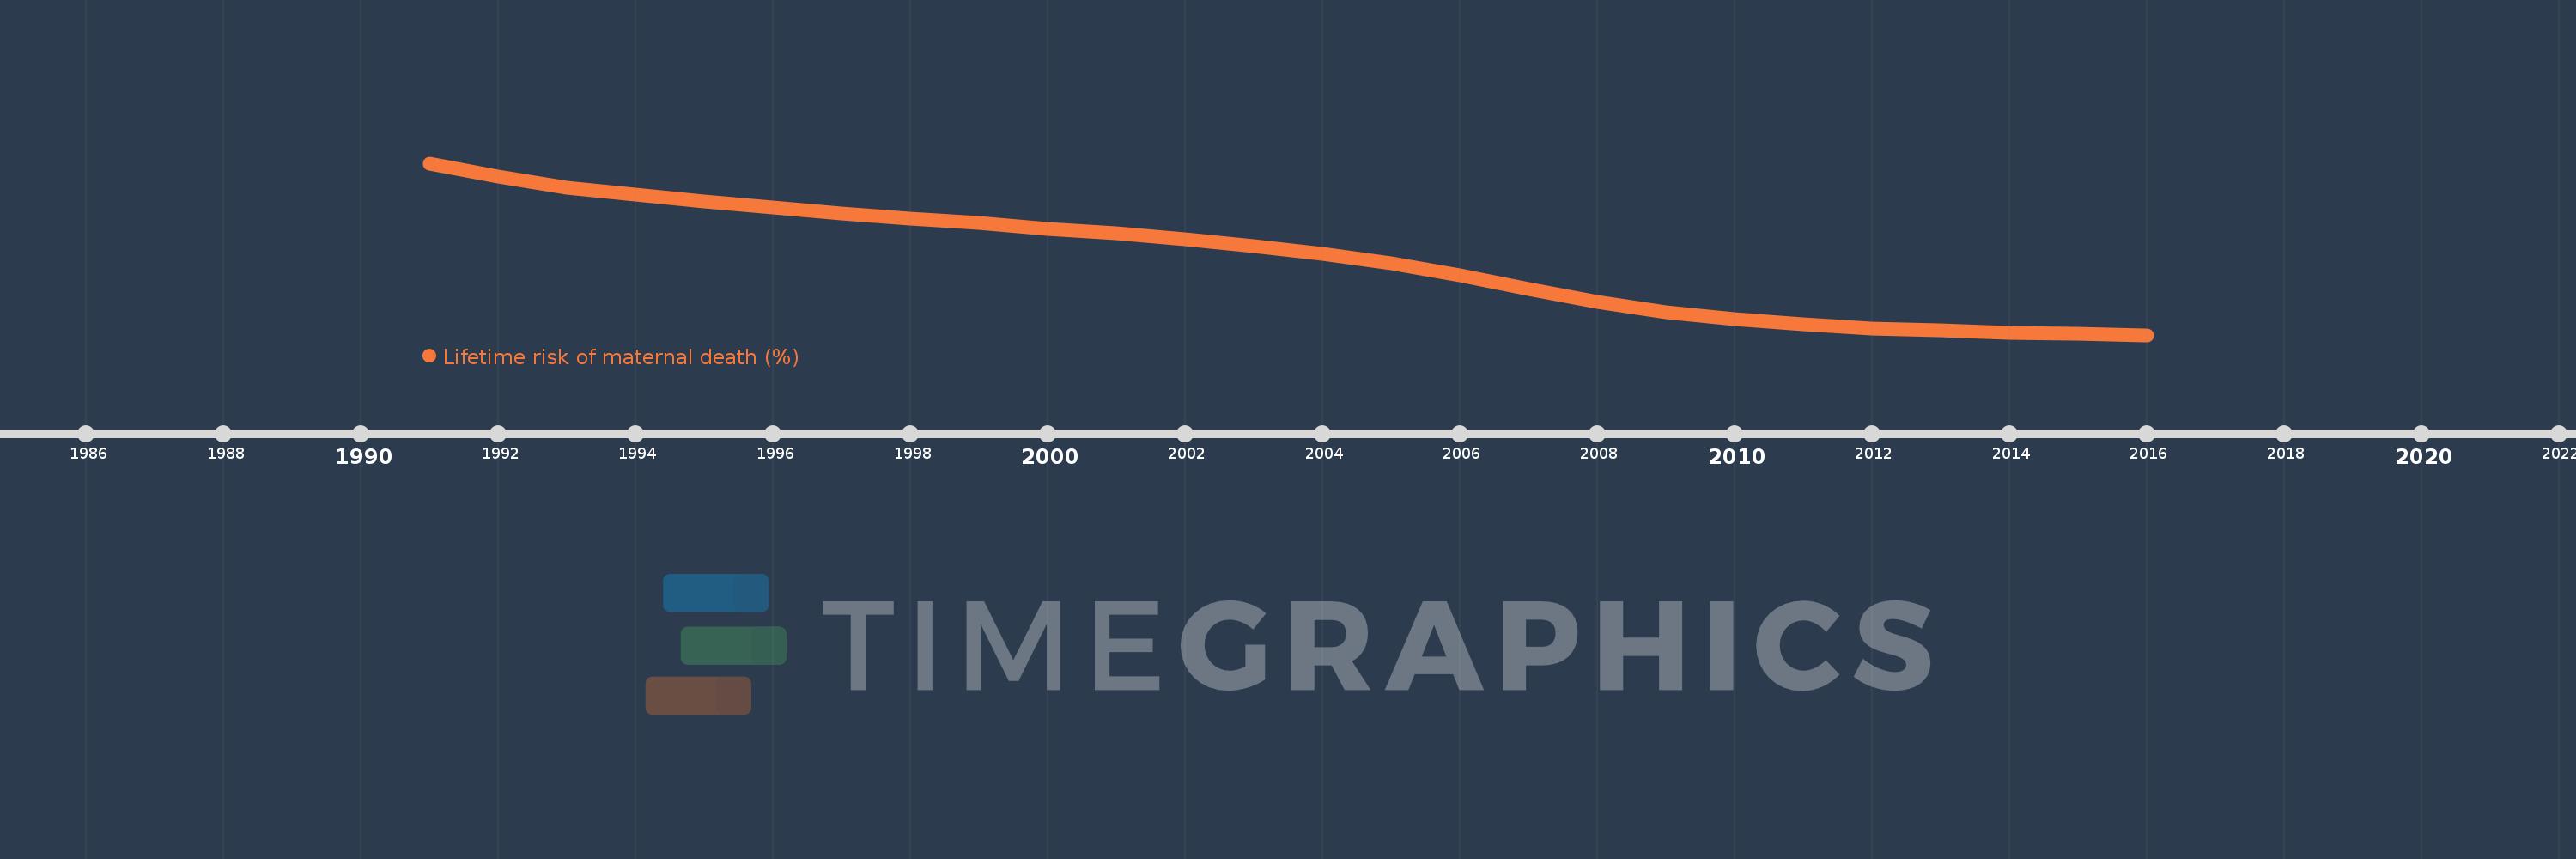
This timeline shows a graph from 1991 to 2016 of Turkey. No data until 1990. Number of actual observations by date: 26.
Source name:
World Development Indicators
Source organization:
WHO, UNICEF, UNFPA, The World Bank, and the United Nations Population Division. Trends in Maternal Mortality: 1990 to 2015. Geneva, World Health Organization, 2015
Categories, topics:
Health, Gender
Last updated:
apr 23, 2017
Indicators value changes by year
Meaning:
0.169
Minimum:
0.034
jan 1, 2016
Maximum:
0.34
jan 1, 1991
At the date of observation
Value
Absolute change
Change from the previous value
jan 1, 1991
0.34
+0.34
0.0%
jan 1, 1992
0.316
-0.024
-7.13%
jan 1, 1993
0.297
-0.019
-5.86%
jan 1, 1994
0.284
-0.013
-4.43%
jan 1, 1995
0.272
-0.012
-4.15%
jan 1, 1996
0.261
-0.011
-4.2%
jan 1, 1997
0.251
-0.01
-3.72%
jan 1, 1998
0.242
-0.009
-3.66%
jan 1, 1999
0.233
-0.009
-3.88%
jan 1, 2000
0.223
-0.01
-4.18%
jan 1, 2001
0.215
-0.008
-3.65%
jan 1, 2002
0.205
-0.01
-4.48%
jan 1, 2003
0.193
-0.012
-6.04%
jan 1, 2004
0.179
-0.014
-7.23%
jan 1, 2005
0.161
-0.017
-9.68%
jan 1, 2006
0.14
-0.021
-13.31%
jan 1, 2007
0.116
-0.024
-17.37%
jan 1, 2008
0.093
-0.023
-19.69%
jan 1, 2009
0.075
-0.018
-19.1%
jan 1, 2010
0.062
-0.013
-17.21%
jan 1, 2011
0.053
-0.009
-14.73%
jan 1, 2012
0.046
-0.007
-12.46%
jan 1, 2013
0.042
-0.005
-9.93%
jan 1, 2014
0.038
-0.003
-8.18%
jan 1, 2015
0.036
-0.003
-6.78%
jan 1, 2016
0.034
-0.002
-5.75%
Ranking of countries by current statistics by years