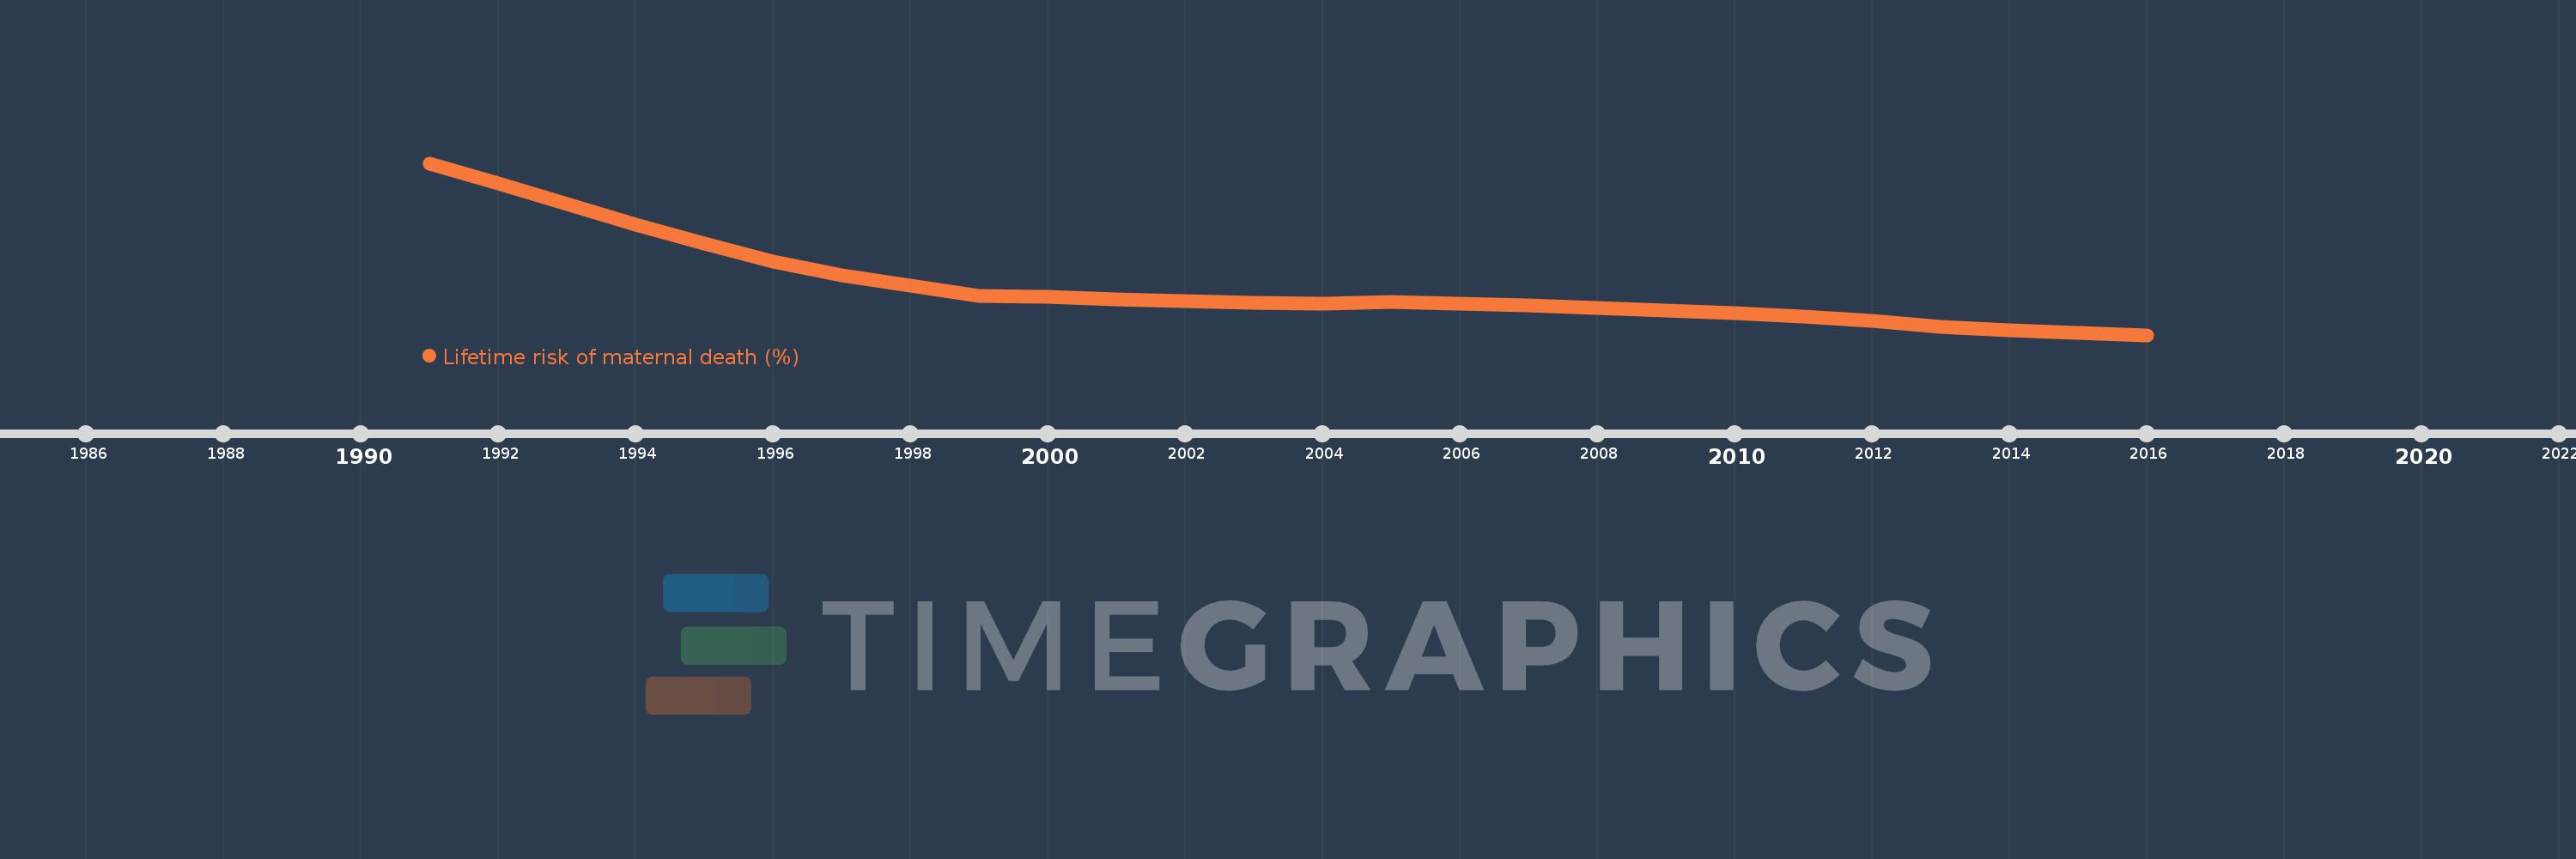
This timeline shows a graph from 1991 to 2016 of Honduras. No data until 1990. Number of actual observations by date: 26.
Source name:
World Development Indicators
Source organization:
WHO, UNICEF, UNFPA, The World Bank, and the United Nations Population Division. Trends in Maternal Mortality: 1990 to 2015. Geneva, World Health Organization, 2015
Categories, topics:
Health, Gender
Last updated:
apr 23, 2017
Indicators value changes by year
Meaning:
0.683
Minimum:
0.337
jan 1, 2016
Maximum:
1.558
jan 1, 1991
At the date of observation
Value
Absolute change
Change from the previous value
jan 1, 1991
1.558
+1.558
0.0%
jan 1, 1992
1.412
-0.146
-9.35%
jan 1, 1993
1.265
-0.148
-10.47%
jan 1, 1994
1.121
-0.143
-11.34%
jan 1, 1995
0.987
-0.134
-11.95%
jan 1, 1996
0.862
-0.125
-12.66%
jan 1, 1997
0.764
-0.098
-11.38%
jan 1, 1998
0.69
-0.074
-9.64%
jan 1, 1999
0.614
-0.076
-11.02%
jan 1, 2000
0.61
-0.004
-0.73%
jan 1, 2001
0.592
-0.017
-2.87%
jan 1, 2002
0.576
-0.016
-2.71%
jan 1, 2003
0.565
-0.011
-1.94%
jan 1, 2004
0.561
-0.004
-0.73%
jan 1, 2005
0.571
+0.01
1.76%
jan 1, 2006
0.557
-0.014
-2.5%
jan 1, 2007
0.545
-0.012
-2.12%
jan 1, 2008
0.528
-0.017
-3.1%
jan 1, 2009
0.514
-0.014
-2.66%
jan 1, 2010
0.494
-0.02
-3.89%
jan 1, 2011
0.468
-0.026
-5.2%
jan 1, 2012
0.435
-0.033
-7.12%
jan 1, 2013
0.398
-0.037
-8.44%
jan 1, 2014
0.37
-0.028
-7.07%
jan 1, 2015
0.352
-0.018
-4.86%
jan 1, 2016
0.337
-0.015
-4.3%
Ranking of countries by current statistics by years