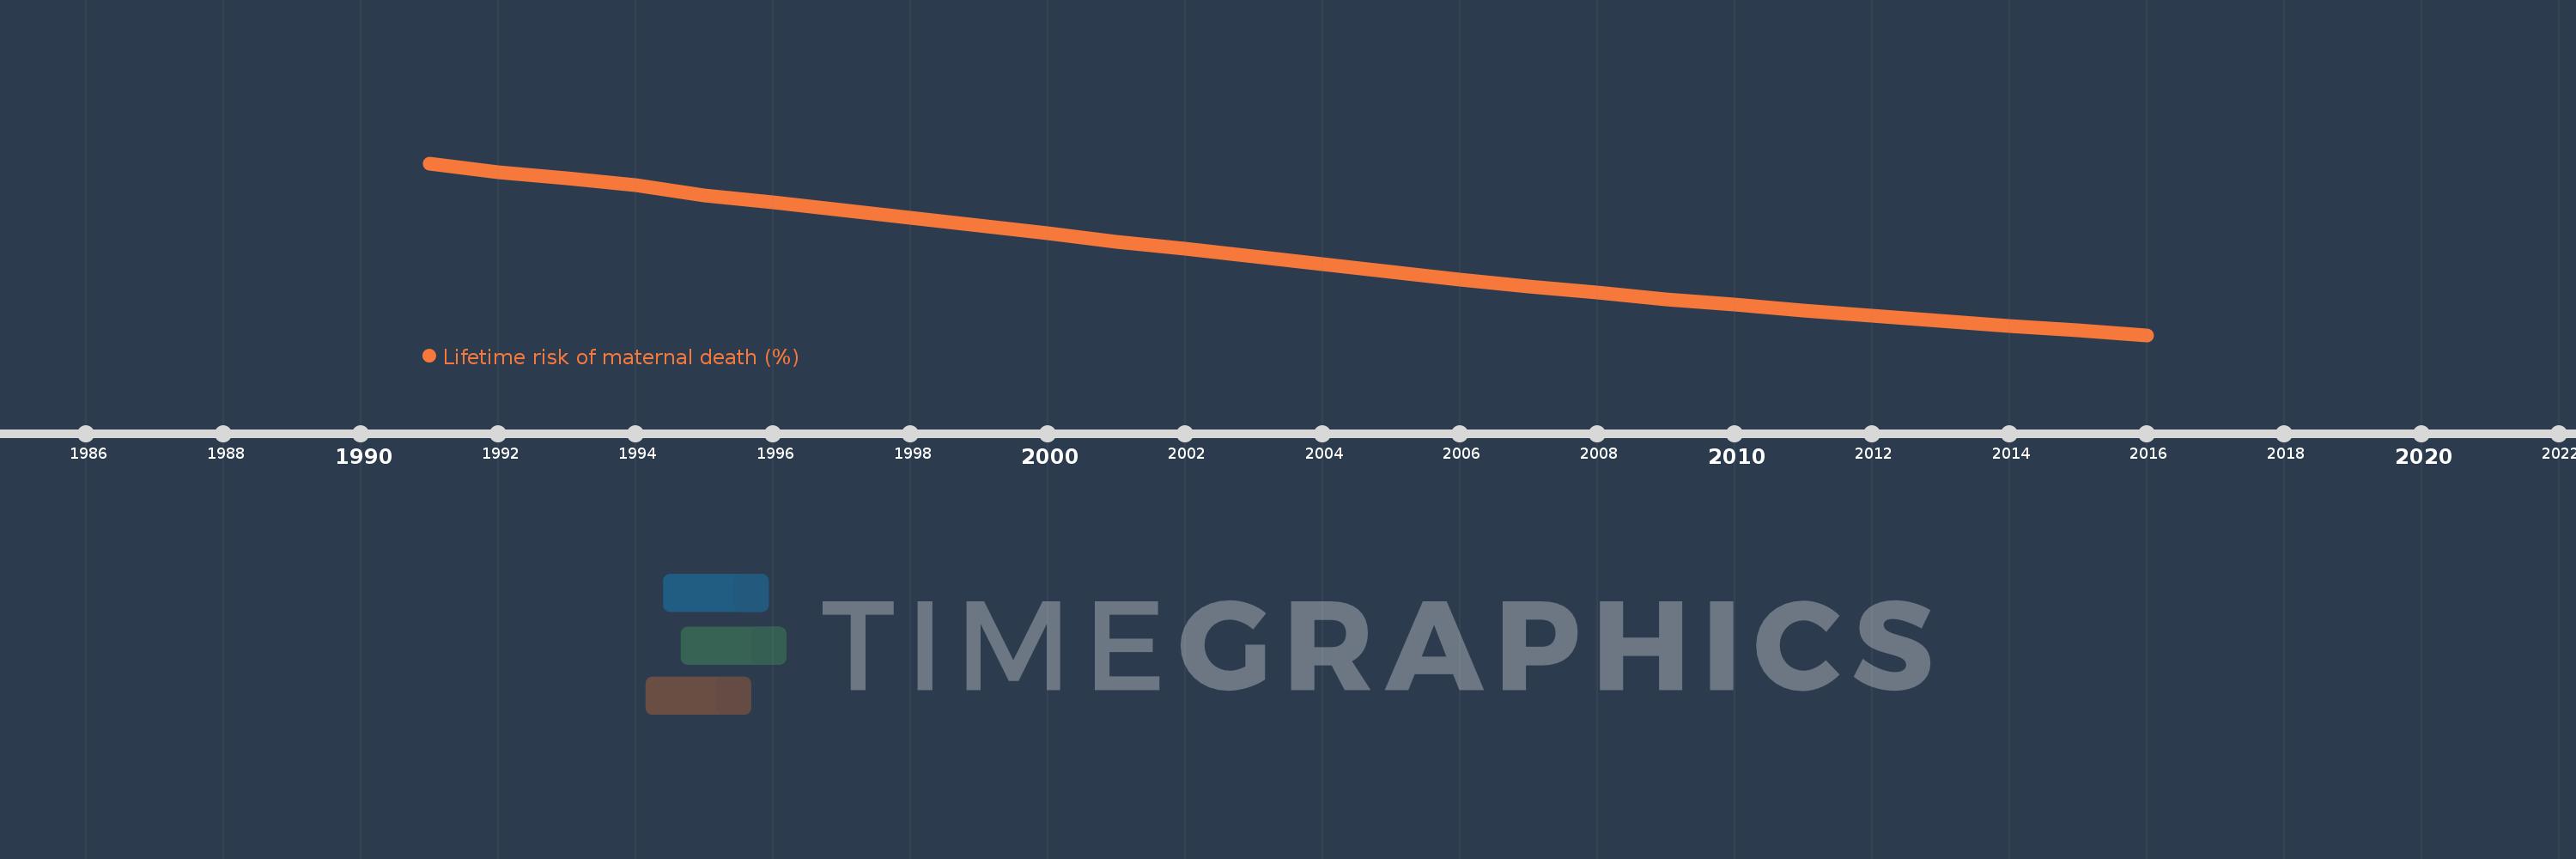
This timeline shows a graph from 1991 to 2016 of IDA only. No data until 1990. Number of actual observations by date: 26.
Source name:
World Development Indicators
Source organization:
WHO, UNICEF, UNFPA, The World Bank, and the United Nations Population Division. Trends in Maternal Mortality: 1990 to 2015. Geneva, World Health Organization, 2015
Categories, topics:
Health, Gender
Last updated:
apr 23, 2017
Indicators value changes by year
Meaning:
3.288
Minimum:
1.837
jan 1, 2016
Maximum:
5.006
jan 1, 1991
At the date of observation
Value
Absolute change
Change from the previous value
jan 1, 1991
5.006
+5.006
0.0%
jan 1, 1992
4.843
-0.162
-3.24%
jan 1, 1993
4.731
-0.113
-2.33%
jan 1, 1994
4.595
-0.136
-2.86%
jan 1, 1995
4.415
-0.18
-3.92%
jan 1, 1996
4.28
-0.134
-3.04%
jan 1, 1997
4.141
-0.139
-3.25%
jan 1, 1998
3.995
-0.146
-3.53%
jan 1, 1999
3.85
-0.145
-3.63%
jan 1, 2000
3.709
-0.14
-3.65%
jan 1, 2001
3.563
-0.146
-3.94%
jan 1, 2002
3.434
-0.129
-3.63%
jan 1, 2003
3.294
-0.14
-4.09%
jan 1, 2004
3.152
-0.142
-4.3%
jan 1, 2005
3.004
-0.148
-4.71%
jan 1, 2006
2.862
-0.142
-4.73%
jan 1, 2007
2.738
-0.123
-4.31%
jan 1, 2008
2.626
-0.112
-4.09%
jan 1, 2009
2.499
-0.127
-4.84%
jan 1, 2010
2.4
-0.099
-3.98%
jan 1, 2011
2.294
-0.106
-4.42%
jan 1, 2012
2.193
-0.1
-4.37%
jan 1, 2013
2.106
-0.088
-4.01%
jan 1, 2014
2.011
-0.094
-4.47%
jan 1, 2015
1.923
-0.089
-4.4%
jan 1, 2016
1.837
-0.086
-4.45%
Ranking of countries by current statistics by years