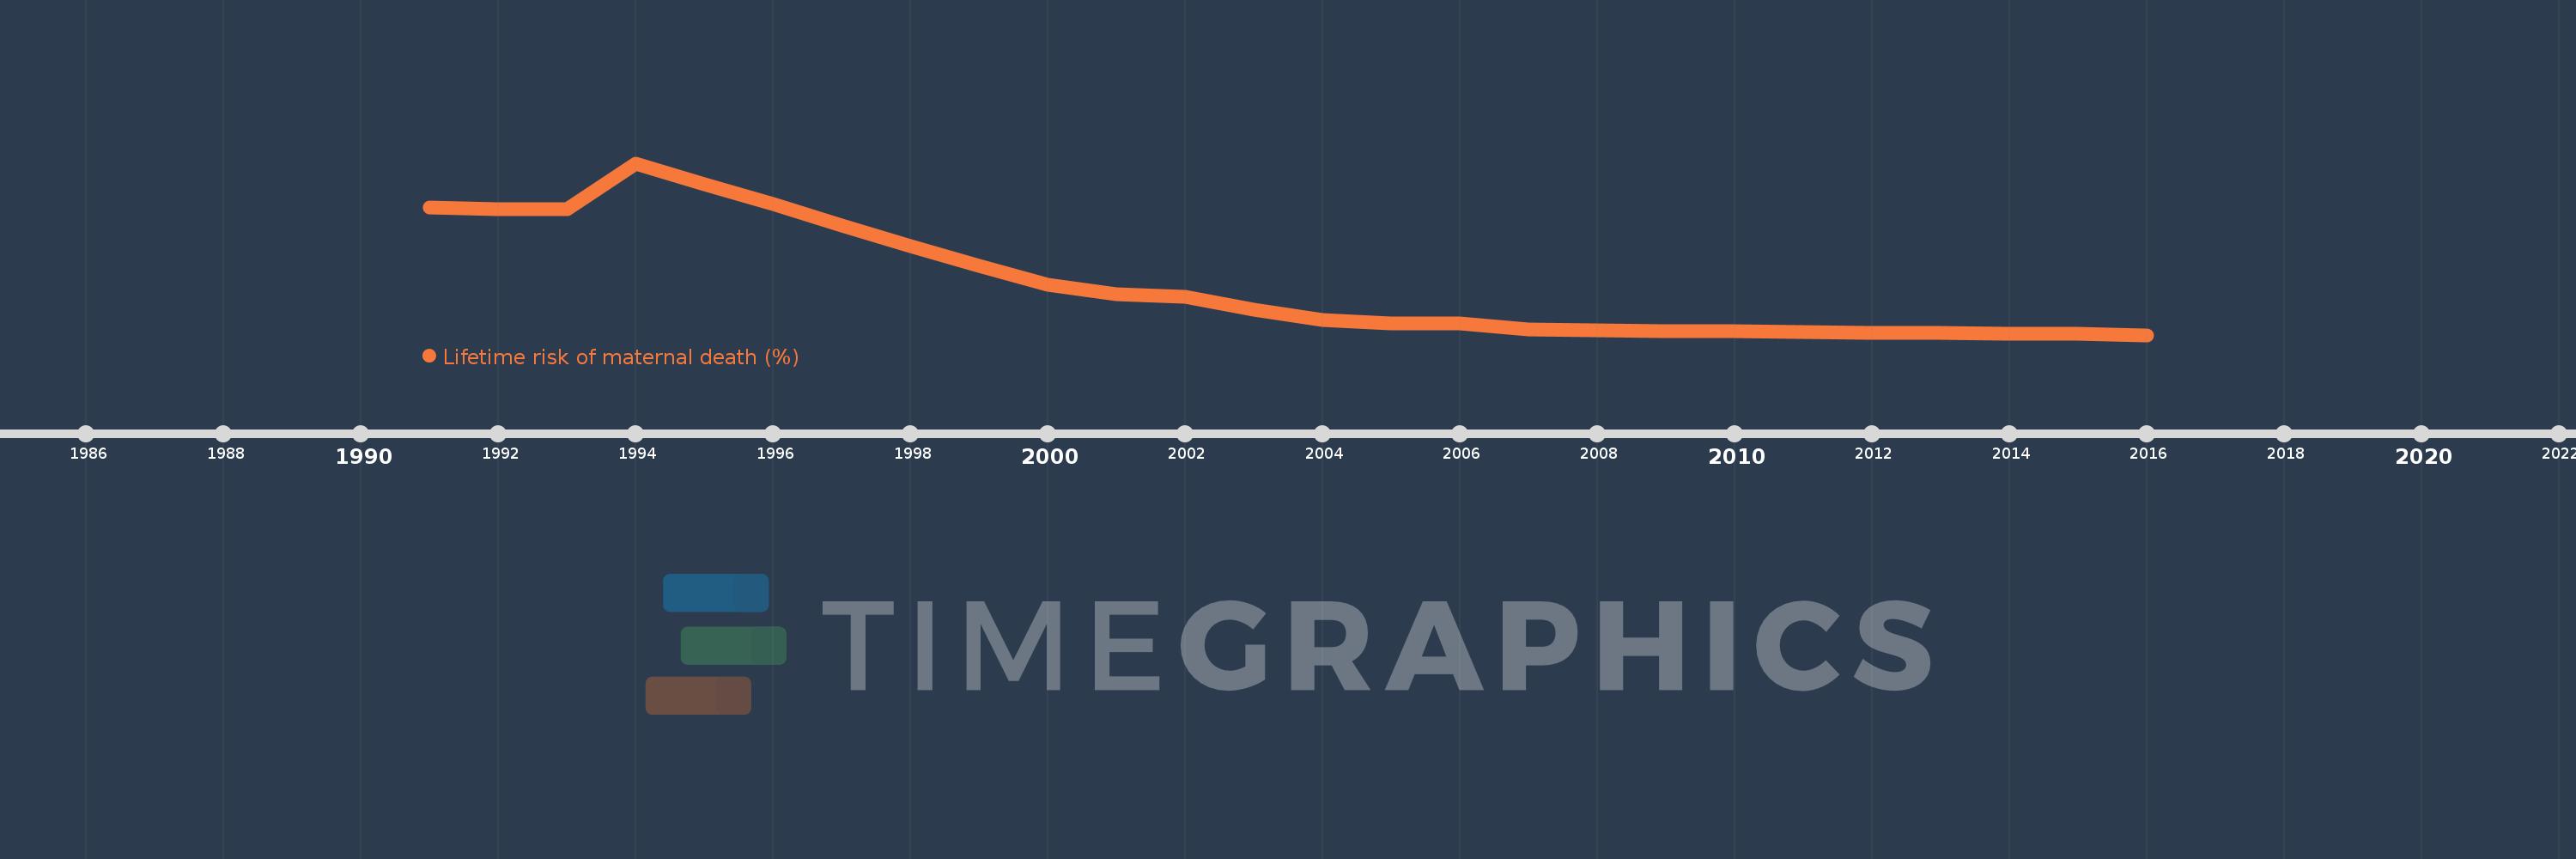
This timeline shows a graph from 1991 to 2016 of Tajikistan. No data until 1990. Number of actual observations by date: 26.
Source name:
World Development Indicators
Source organization:
WHO, UNICEF, UNFPA, The World Bank, and the United Nations Population Division. Trends in Maternal Mortality: 1990 to 2015. Geneva, World Health Organization, 2015
Categories, topics:
Health, Gender
Last updated:
apr 23, 2017
Indicators value changes by year
Meaning:
0.338
Minimum:
0.127
jan 1, 2016
Maximum:
0.839
jan 1, 1994
At the date of observation
Value
Absolute change
Change from the previous value
jan 1, 1991
0.656
+0.656
0.0%
jan 1, 1992
0.648
-0.008
-1.23%
jan 1, 1993
0.647
-0.001
-0.23%
jan 1, 1994
0.839
+0.192
29.76%
jan 1, 1995
0.753
-0.086
-10.24%
jan 1, 1996
0.671
-0.082
-10.9%
jan 1, 1997
0.582
-0.089
-13.19%
jan 1, 1998
0.497
-0.086
-14.76%
jan 1, 1999
0.414
-0.083
-16.65%
jan 1, 2000
0.334
-0.08
-19.25%
jan 1, 2001
0.296
-0.038
-11.35%
jan 1, 2002
0.286
-0.01
-3.3%
jan 1, 2003
0.233
-0.053
-18.53%
jan 1, 2004
0.189
-0.044
-18.82%
jan 1, 2005
0.176
-0.014
-7.17%
jan 1, 2006
0.174
-0.001
-0.8%
jan 1, 2007
0.149
-0.025
-14.42%
jan 1, 2008
0.146
-0.004
-2.36%
jan 1, 2009
0.143
-0.003
-1.78%
jan 1, 2010
0.142
-0.001
-0.87%
jan 1, 2011
0.139
-0.003
-2.36%
jan 1, 2012
0.137
-0.001
-0.99%
jan 1, 2013
0.136
-0.002
-1.16%
jan 1, 2014
0.134
-0.001
-0.91%
jan 1, 2015
0.131
-0.003
-2.27%
jan 1, 2016
0.127
-0.004
-3.22%
Ranking of countries by current statistics by years