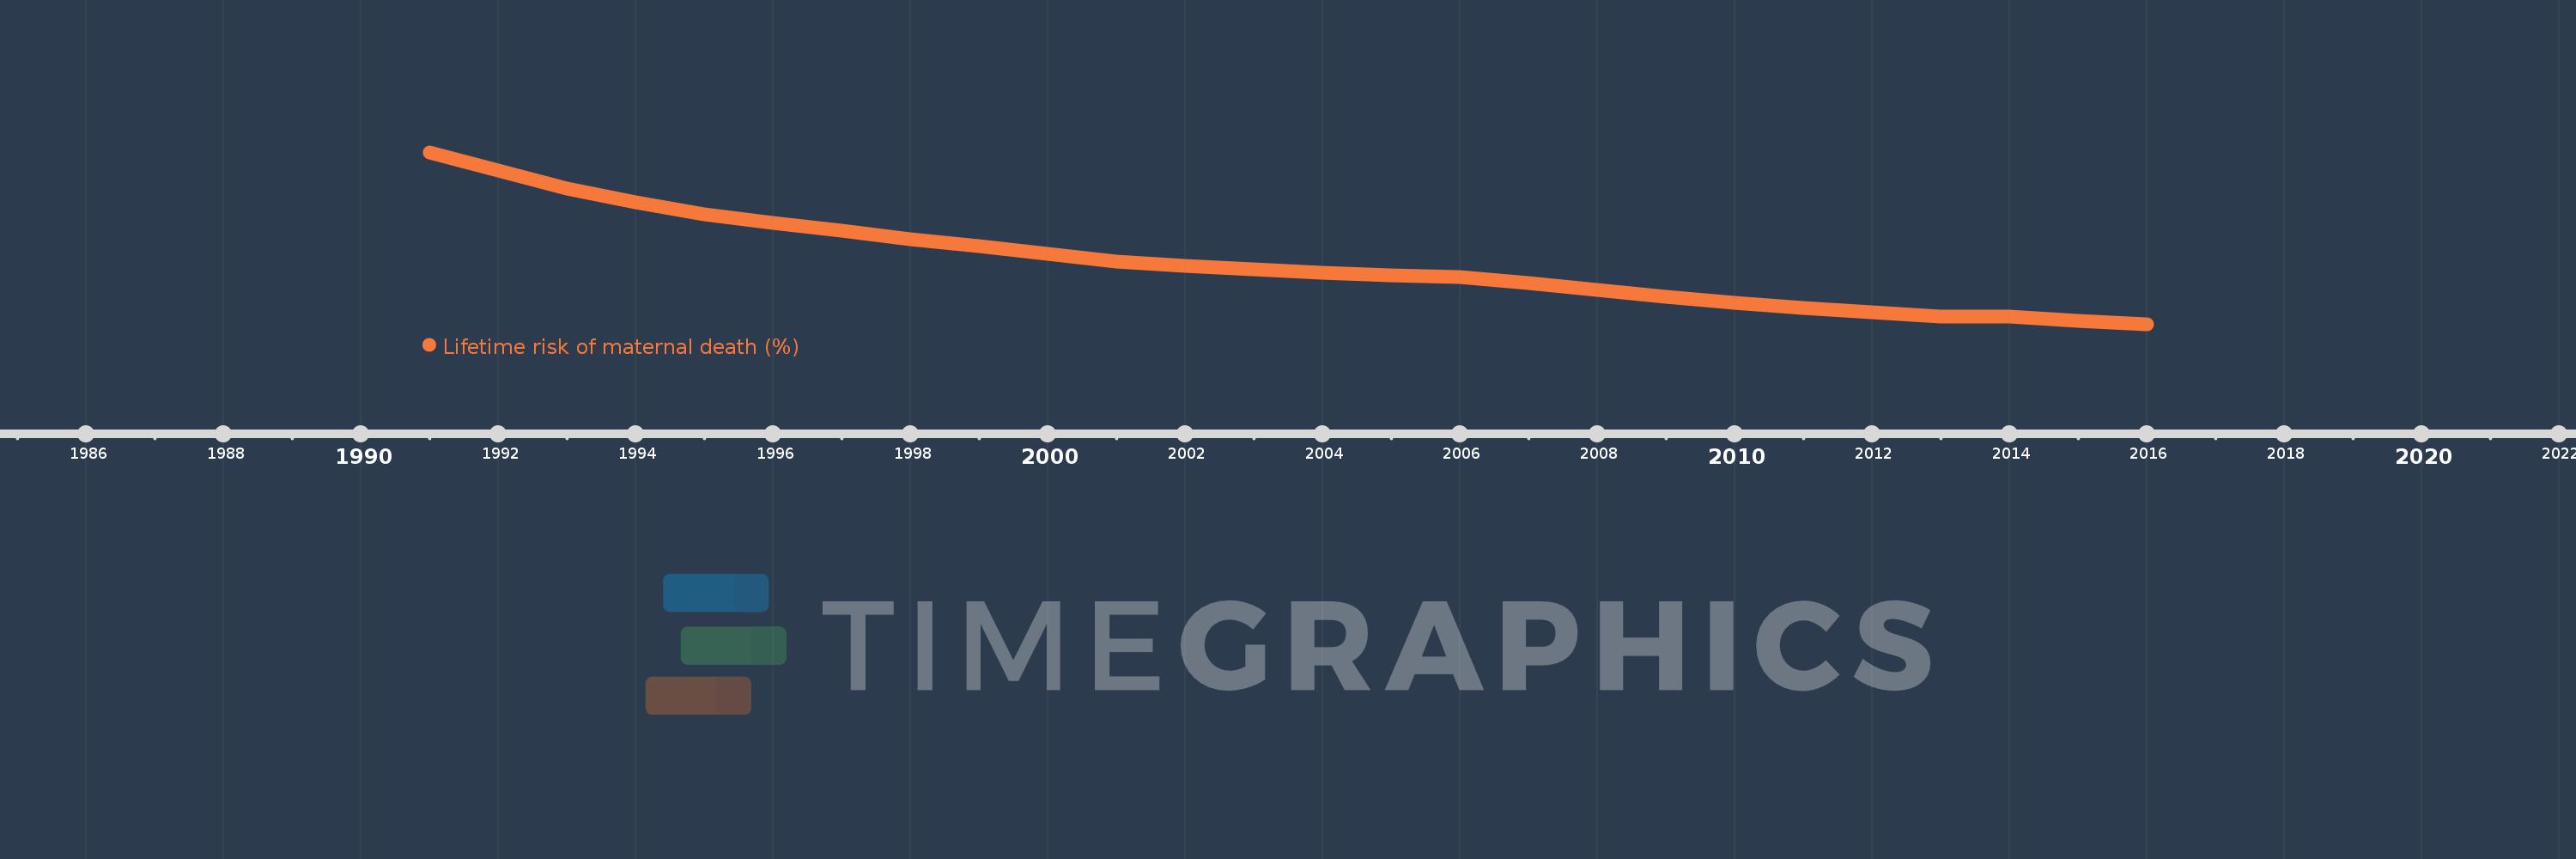
This timeline shows a graph from 1991 to 2016 of Swaziland. No data until 1990. Number of actual observations by date: 26.
Source name:
World Development Indicators
Source organization:
WHO, UNICEF, UNFPA, The World Bank, and the United Nations Population Division. Trends in Maternal Mortality: 1990 to 2015. Geneva, World Health Organization, 2015
Categories, topics:
Health, Gender
Last updated:
apr 23, 2017
Indicators value changes by year
Meaning:
2.154
Minimum:
1.311
jan 1, 2016
Maximum:
3.645
jan 1, 1991
At the date of observation
Value
Absolute change
Change from the previous value
jan 1, 1991
3.645
+3.645
0.0%
jan 1, 1992
3.397
-0.248
-6.79%
jan 1, 1993
3.156
-0.241
-7.09%
jan 1, 1994
2.965
-0.191
-6.04%
jan 1, 1995
2.809
-0.156
-5.26%
jan 1, 1996
2.683
-0.127
-4.51%
jan 1, 1997
2.579
-0.104
-3.87%
jan 1, 1998
2.46
-0.119
-4.61%
jan 1, 1999
2.366
-0.095
-3.84%
jan 1, 2000
2.266
-0.1
-4.21%
jan 1, 2001
2.161
-0.106
-4.66%
jan 1, 2002
2.108
-0.053
-2.43%
jan 1, 2003
2.056
-0.052
-2.47%
jan 1, 2004
2.011
-0.045
-2.18%
jan 1, 2005
1.974
-0.037
-1.84%
jan 1, 2006
1.948
-0.027
-1.34%
jan 1, 2007
1.87
-0.078
-3.99%
jan 1, 2008
1.774
-0.096
-5.12%
jan 1, 2009
1.68
-0.095
-5.34%
jan 1, 2010
1.599
-0.081
-4.81%
jan 1, 2011
1.531
-0.068
-4.28%
jan 1, 2012
1.474
-0.056
-3.69%
jan 1, 2013
1.418
-0.056
-3.8%
jan 1, 2014
1.412
-0.006
-0.43%
jan 1, 2015
1.36
-0.051
-3.65%
jan 1, 2016
1.311
-0.049
-3.64%
Ranking of countries by current statistics by years