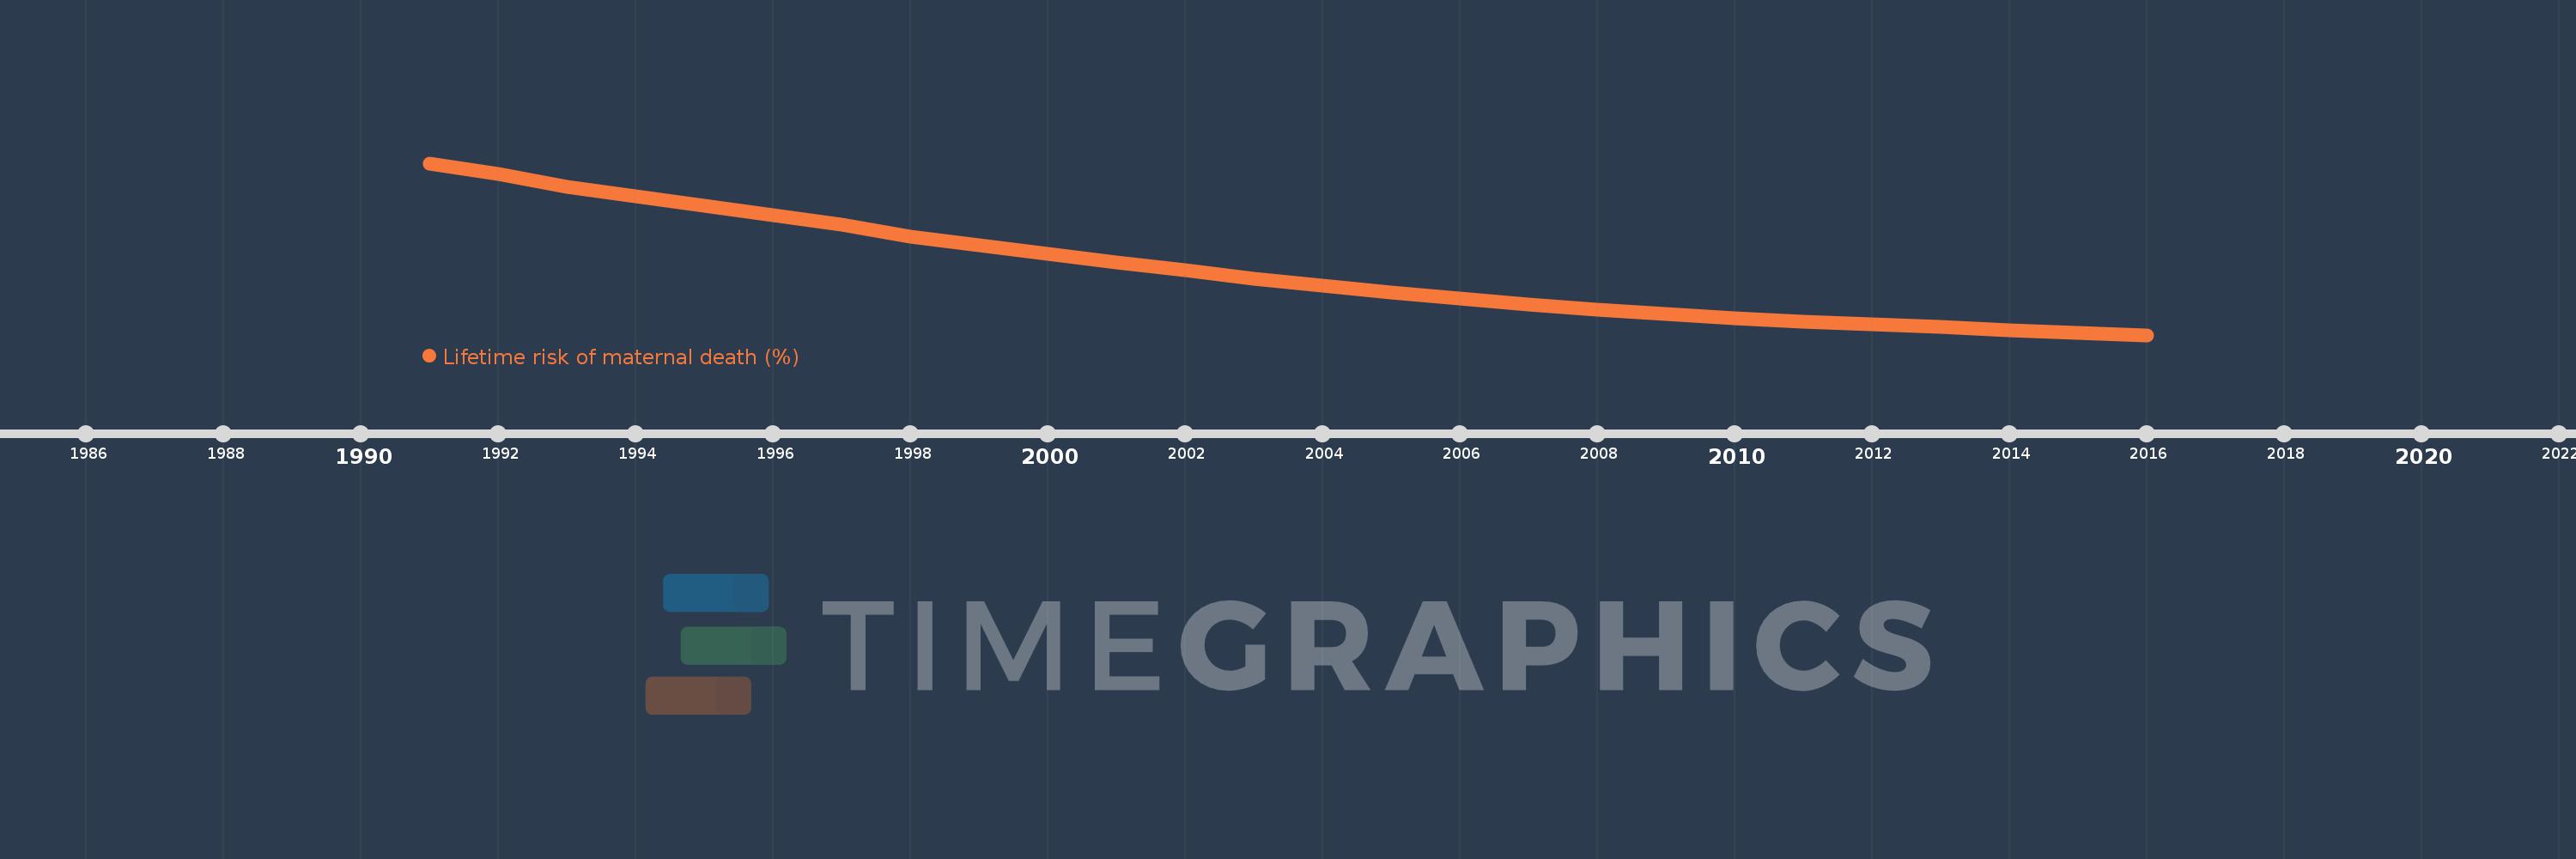
This timeline shows a graph from 1991 to 2016 of Vanuatu. No data until 1990. Number of actual observations by date: 26.
Source name:
World Development Indicators
Source organization:
WHO, UNICEF, UNFPA, The World Bank, and the United Nations Population Division. Trends in Maternal Mortality: 1990 to 2015. Geneva, World Health Organization, 2015
Categories, topics:
Health, Gender
Last updated:
apr 23, 2017
Indicators value changes by year
Meaning:
0.625
Minimum:
0.281
jan 1, 2016
Maximum:
1.182
jan 1, 1991
At the date of observation
Value
Absolute change
Change from the previous value
jan 1, 1991
1.182
+1.182
0.0%
jan 1, 1992
1.127
-0.055
-4.67%
jan 1, 1993
1.059
-0.068
-6.07%
jan 1, 1994
1.008
-0.051
-4.79%
jan 1, 1995
0.96
-0.047
-4.7%
jan 1, 1996
0.91
-0.05
-5.22%
jan 1, 1997
0.858
-0.053
-5.78%
jan 1, 1998
0.799
-0.059
-6.86%
jan 1, 1999
0.751
-0.048
-5.99%
jan 1, 2000
0.705
-0.046
-6.13%
jan 1, 2001
0.663
-0.042
-5.98%
jan 1, 2002
0.619
-0.044
-6.64%
jan 1, 2003
0.577
-0.041
-6.68%
jan 1, 2004
0.541
-0.036
-6.29%
jan 1, 2005
0.505
-0.037
-6.75%
jan 1, 2006
0.473
-0.032
-6.3%
jan 1, 2007
0.439
-0.034
-7.13%
jan 1, 2008
0.412
-0.027
-6.21%
jan 1, 2009
0.39
-0.022
-5.39%
jan 1, 2010
0.371
-0.018
-4.7%
jan 1, 2011
0.353
-0.018
-4.96%
jan 1, 2012
0.339
-0.014
-4.0%
jan 1, 2013
0.322
-0.017
-4.9%
jan 1, 2014
0.306
-0.016
-5.08%
jan 1, 2015
0.293
-0.013
-4.31%
jan 1, 2016
0.281
-0.011
-3.85%
Ranking of countries by current statistics by years