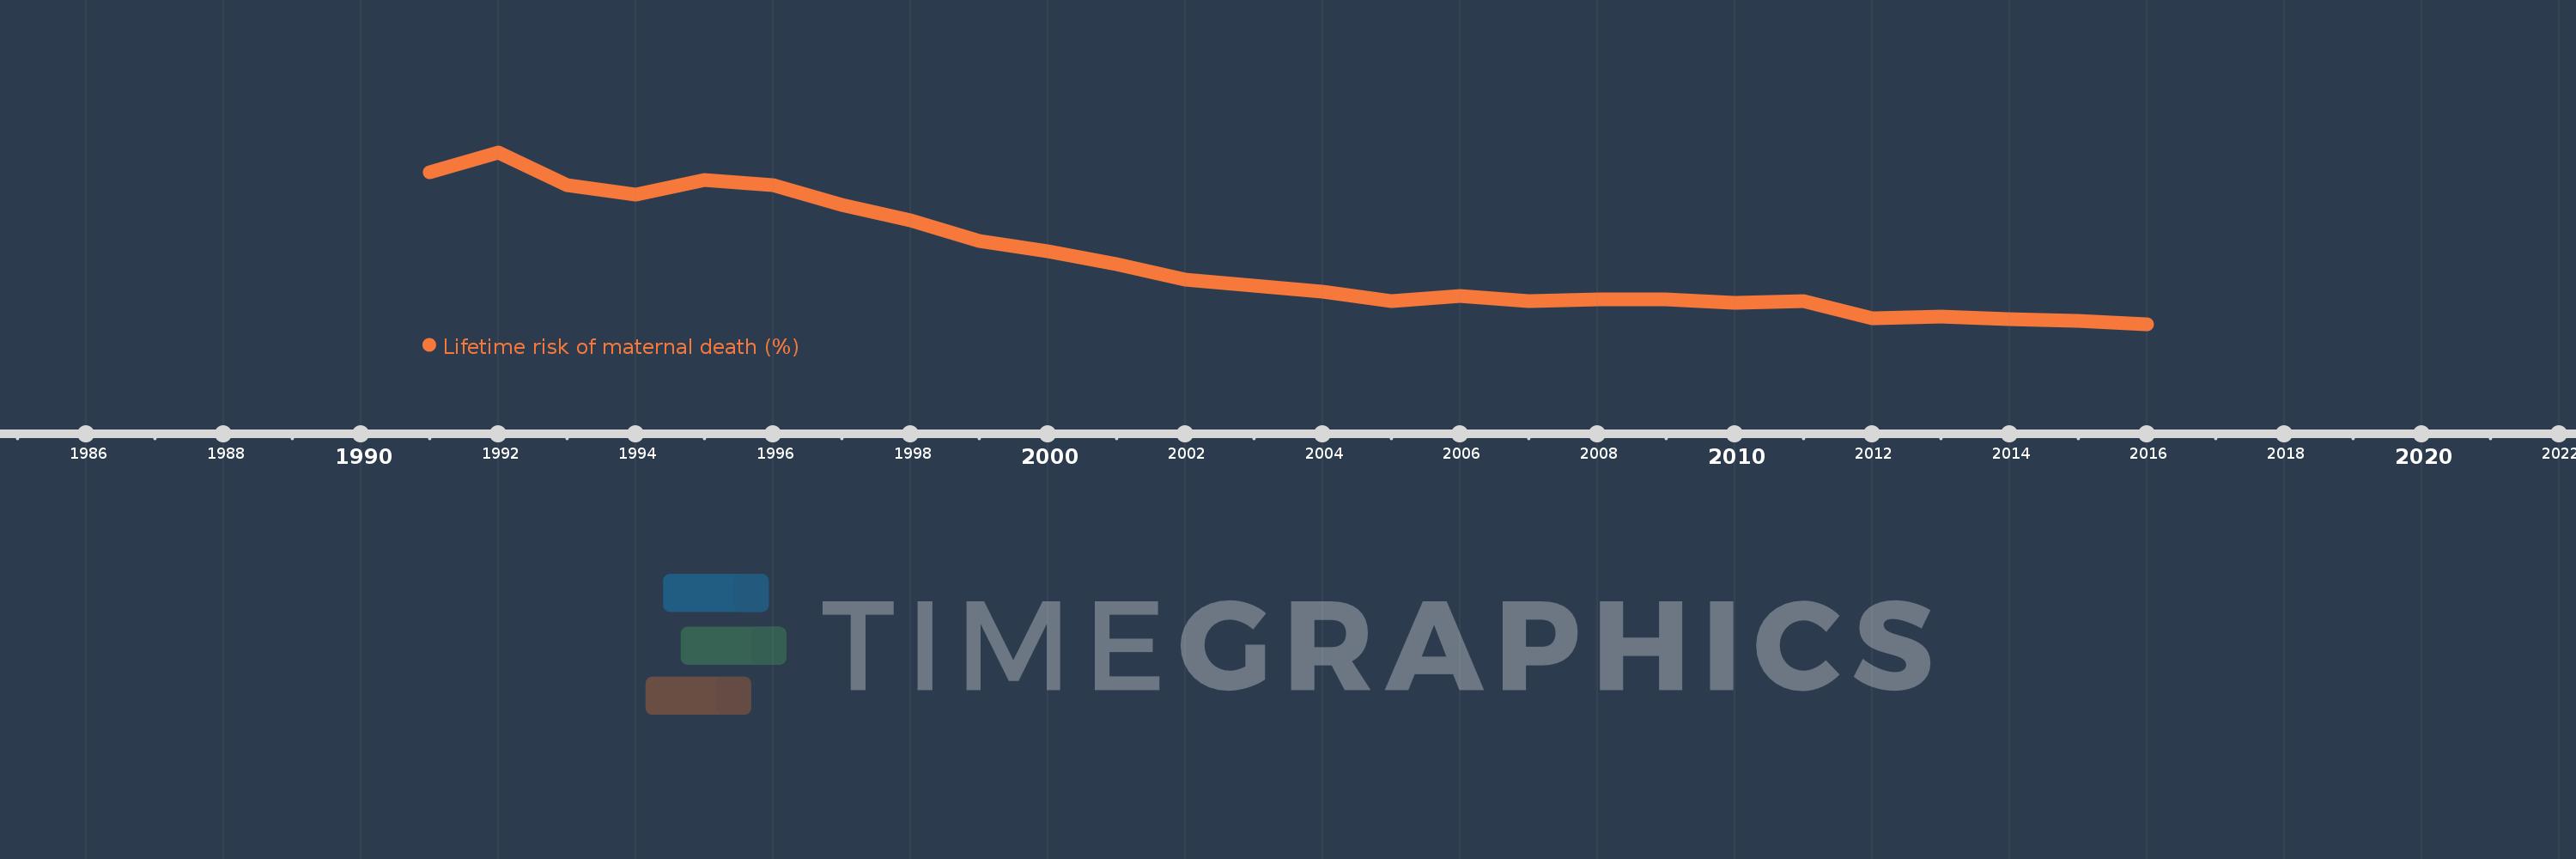
This timeline shows a graph from 1991 to 2016 of Moldova. No data until 1990. Number of actual observations by date: 26.
Source name:
World Development Indicators
Source organization:
WHO, UNICEF, UNFPA, The World Bank, and the United Nations Population Division. Trends in Maternal Mortality: 1990 to 2015. Geneva, World Health Organization, 2015
Categories, topics:
Health, Gender
Last updated:
apr 23, 2017
Indicators value changes by year
Meaning:
0.071
Minimum:
0.031
jan 1, 2016
Maximum:
0.142
jan 1, 1992
At the date of observation
Value
Absolute change
Change from the previous value
jan 1, 1991
0.129
+0.129
0.0%
jan 1, 1992
0.142
+0.013
10.42%
jan 1, 1993
0.121
-0.021
-14.47%
jan 1, 1994
0.115
-0.007
-5.4%
jan 1, 1995
0.124
+0.009
8.04%
jan 1, 1996
0.121
-0.003
-2.1%
jan 1, 1997
0.108
-0.014
-11.15%
jan 1, 1998
0.098
-0.01
-9.14%
jan 1, 1999
0.085
-0.013
-13.49%
jan 1, 2000
0.078
-0.007
-8.29%
jan 1, 2001
0.07
-0.008
-9.91%
jan 1, 2002
0.06
-0.01
-14.1%
jan 1, 2003
0.056
-0.004
-6.69%
jan 1, 2004
0.052
-0.004
-7.55%
jan 1, 2005
0.046
-0.006
-11.5%
jan 1, 2006
0.049
+0.003
6.25%
jan 1, 2007
0.046
-0.003
-5.26%
jan 1, 2008
0.047
+0.001
2.15%
jan 1, 2009
0.047
-0.001
-1.29%
jan 1, 2010
0.045
-0.002
-3.37%
jan 1, 2011
0.046
+0.001
3.0%
jan 1, 2012
0.035
-0.011
-24.24%
jan 1, 2013
0.036
+0.001
2.5%
jan 1, 2014
0.034
-0.002
-6.5%
jan 1, 2015
0.033
-0.001
-3.48%
jan 1, 2016
0.031
-0.001
-3.16%
Ranking of countries by current statistics by years