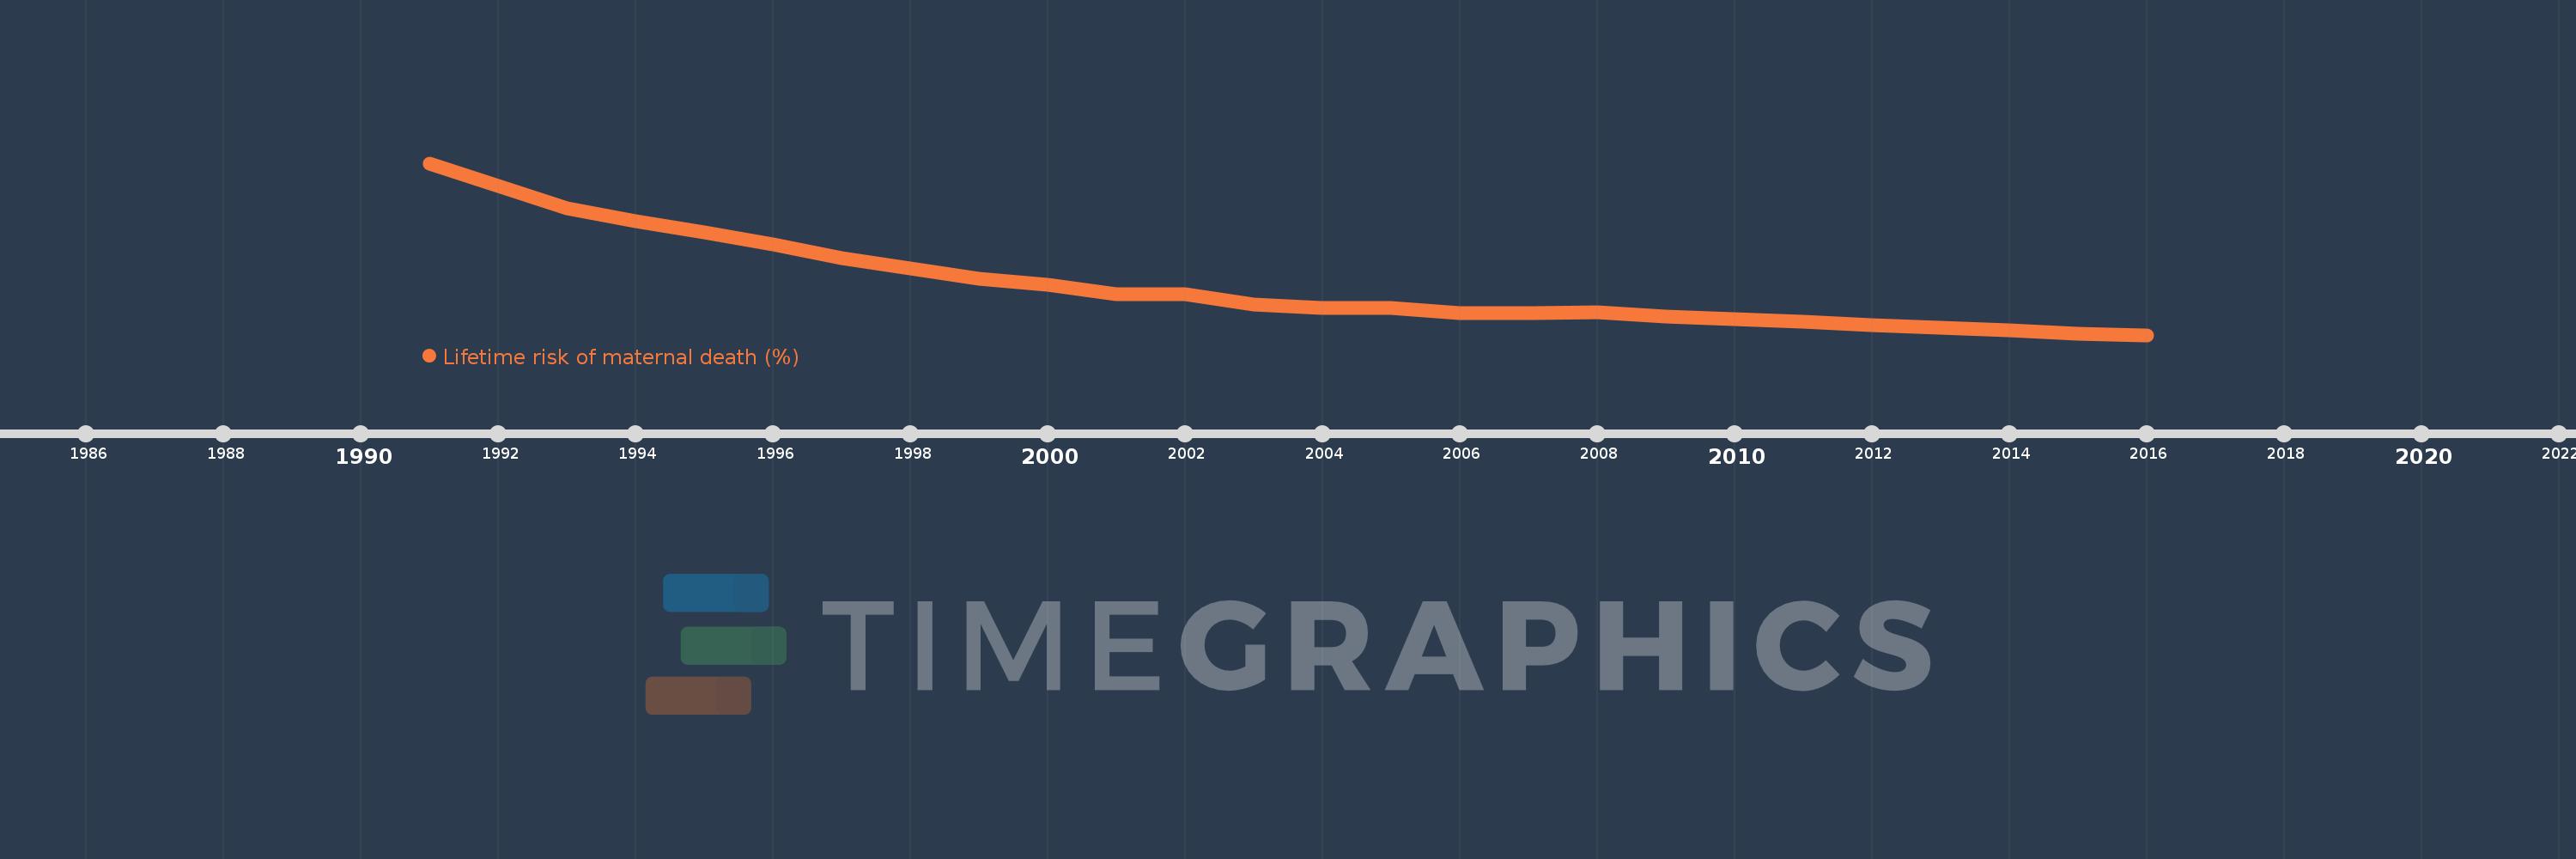
This timeline shows a graph from 1991 to 2016 of Chile. No data until 1990. Number of actual observations by date: 26.
Source name:
World Development Indicators
Source organization:
WHO, UNICEF, UNFPA, The World Bank, and the United Nations Population Division. Trends in Maternal Mortality: 1990 to 2015. Geneva, World Health Organization, 2015
Categories, topics:
Health, Gender
Last updated:
apr 23, 2017
Indicators value changes by year
Meaning:
0.074
Minimum:
0.039
jan 1, 2016
Maximum:
0.158
jan 1, 1991
At the date of observation
Value
Absolute change
Change from the previous value
jan 1, 1991
0.158
+0.158
0.0%
jan 1, 1992
0.142
-0.016
-10.08%
jan 1, 1993
0.127
-0.015
-10.44%
jan 1, 1994
0.118
-0.009
-7.35%
jan 1, 1995
0.11
-0.008
-6.83%
jan 1, 1996
0.102
-0.008
-7.2%
jan 1, 1997
0.092
-0.009
-9.24%
jan 1, 1998
0.085
-0.008
-8.32%
jan 1, 1999
0.078
-0.007
-8.0%
jan 1, 2000
0.074
-0.003
-4.45%
jan 1, 2001
0.067
-0.008
-10.25%
jan 1, 2002
0.067
+0.0
0.49%
jan 1, 2003
0.06
-0.007
-10.53%
jan 1, 2004
0.058
-0.002
-3.13%
jan 1, 2005
0.058
0.0
-0.38%
jan 1, 2006
0.054
-0.004
-7.47%
jan 1, 2007
0.054
+0.0
0.68%
jan 1, 2008
0.055
+0.001
1.15%
jan 1, 2009
0.052
-0.003
-5.23%
jan 1, 2010
0.05
-0.002
-3.07%
jan 1, 2011
0.048
-0.003
-5.02%
jan 1, 2012
0.046
-0.002
-4.31%
jan 1, 2013
0.044
-0.002
-4.29%
jan 1, 2014
0.042
-0.002
-3.84%
jan 1, 2015
0.04
-0.001
-3.56%
jan 1, 2016
0.039
-0.001
-3.21%
Ranking of countries by current statistics by years