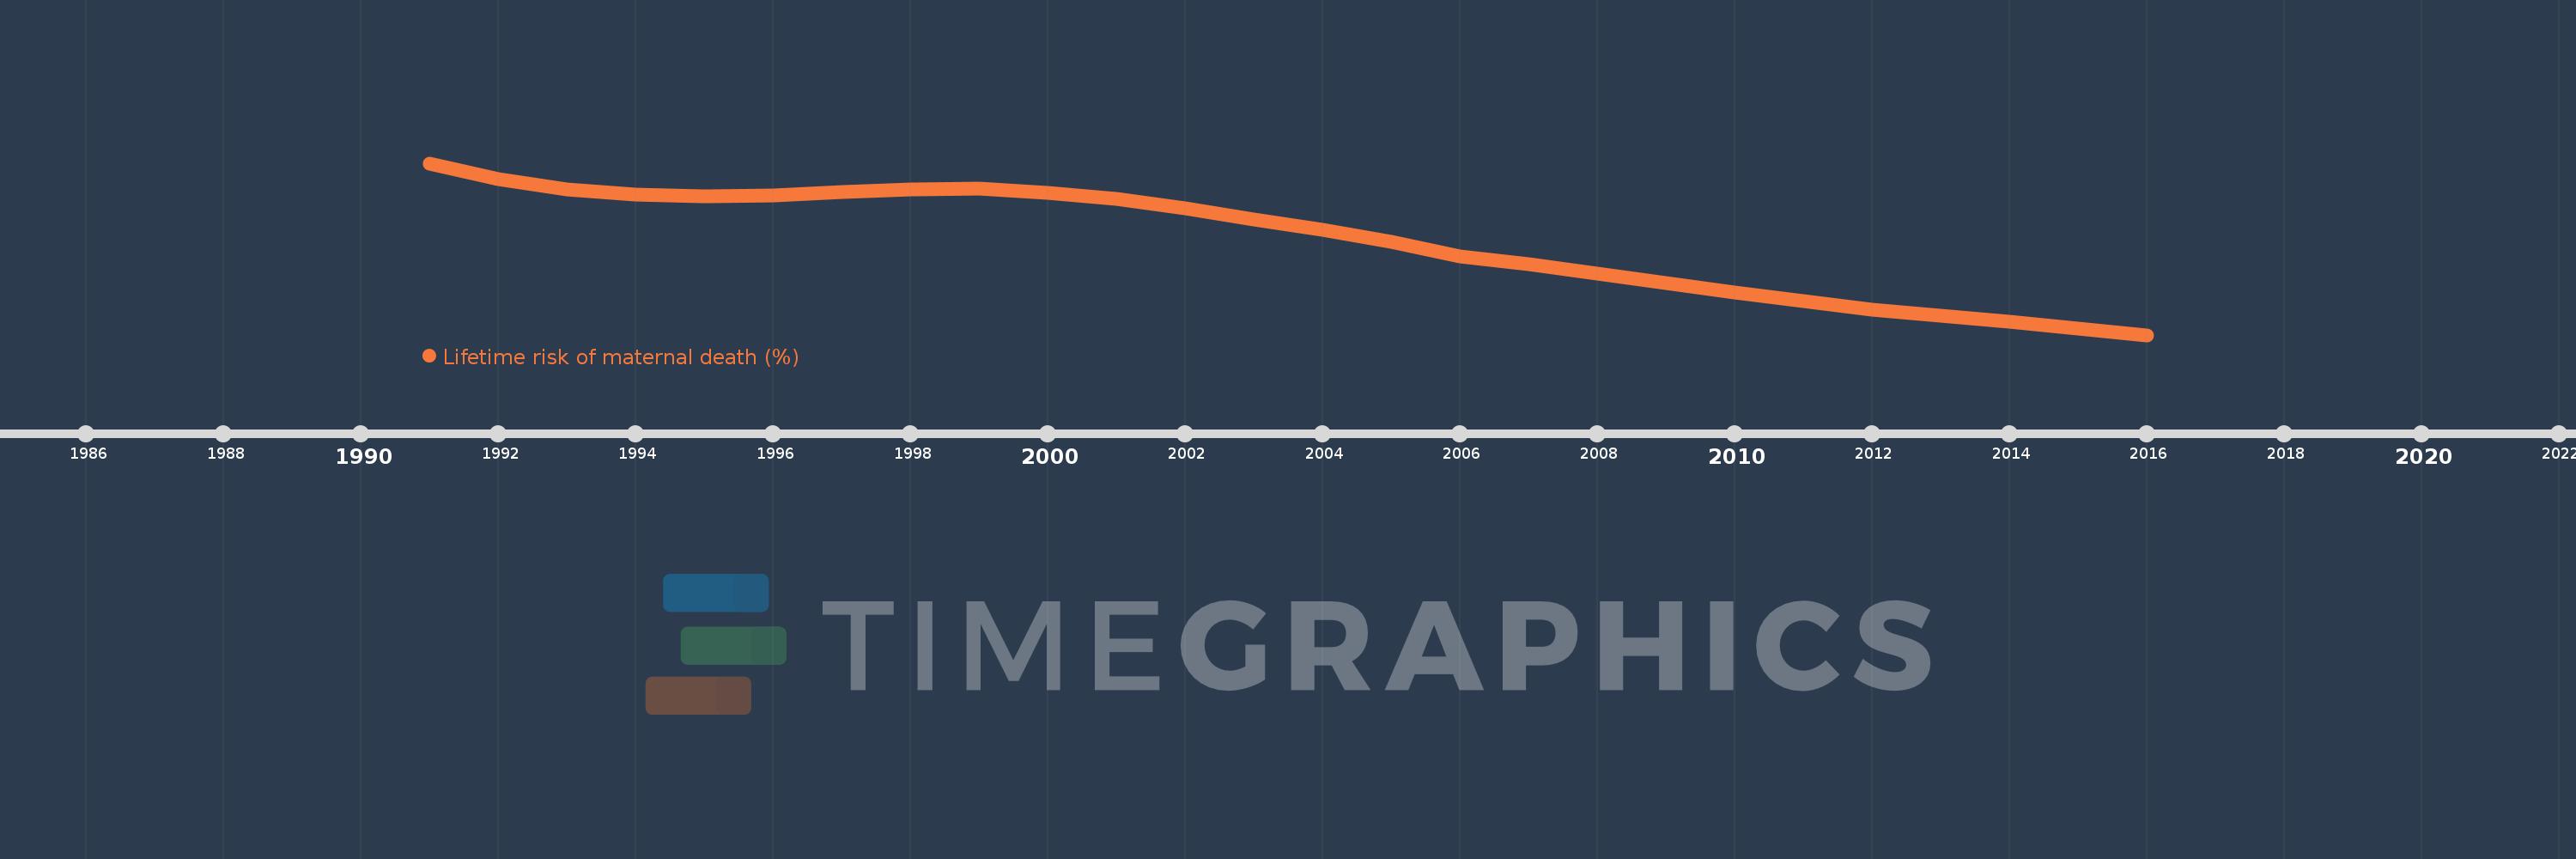
This timeline shows a graph from 1991 to 2016 of Benin. No data until 1990. Number of actual observations by date: 26.
Source name:
World Development Indicators
Source organization:
WHO, UNICEF, UNFPA, The World Bank, and the United Nations Population Division. Trends in Maternal Mortality: 1990 to 2015. Geneva, World Health Organization, 2015
Categories, topics:
Health, Gender
Last updated:
apr 23, 2017
Indicators value changes by year
Meaning:
3.011
Minimum:
1.974
jan 1, 2016
Maximum:
3.865
jan 1, 1991
At the date of observation
Value
Absolute change
Change from the previous value
jan 1, 1991
3.865
+3.865
0.0%
jan 1, 1992
3.694
-0.171
-4.43%
jan 1, 1993
3.576
-0.117
-3.18%
jan 1, 1994
3.519
-0.057
-1.61%
jan 1, 1995
3.503
-0.016
-0.45%
jan 1, 1996
3.51
+0.007
0.2%
jan 1, 1997
3.55
+0.039
1.13%
jan 1, 1998
3.577
+0.027
0.77%
jan 1, 1999
3.584
+0.007
0.2%
jan 1, 2000
3.541
-0.043
-1.21%
jan 1, 2001
3.477
-0.064
-1.81%
jan 1, 2002
3.365
-0.111
-3.21%
jan 1, 2003
3.246
-0.119
-3.55%
jan 1, 2004
3.134
-0.112
-3.46%
jan 1, 2005
3.003
-0.131
-4.17%
jan 1, 2006
2.837
-0.166
-5.52%
jan 1, 2007
2.756
-0.081
-2.84%
jan 1, 2008
2.646
-0.11
-4.01%
jan 1, 2009
2.542
-0.104
-3.91%
jan 1, 2010
2.439
-0.103
-4.06%
jan 1, 2011
2.343
-0.096
-3.94%
jan 1, 2012
2.255
-0.087
-3.73%
jan 1, 2013
2.187
-0.069
-3.05%
jan 1, 2014
2.119
-0.068
-3.09%
jan 1, 2015
2.046
-0.073
-3.43%
jan 1, 2016
1.974
-0.072
-3.53%
Ranking of countries by current statistics by years