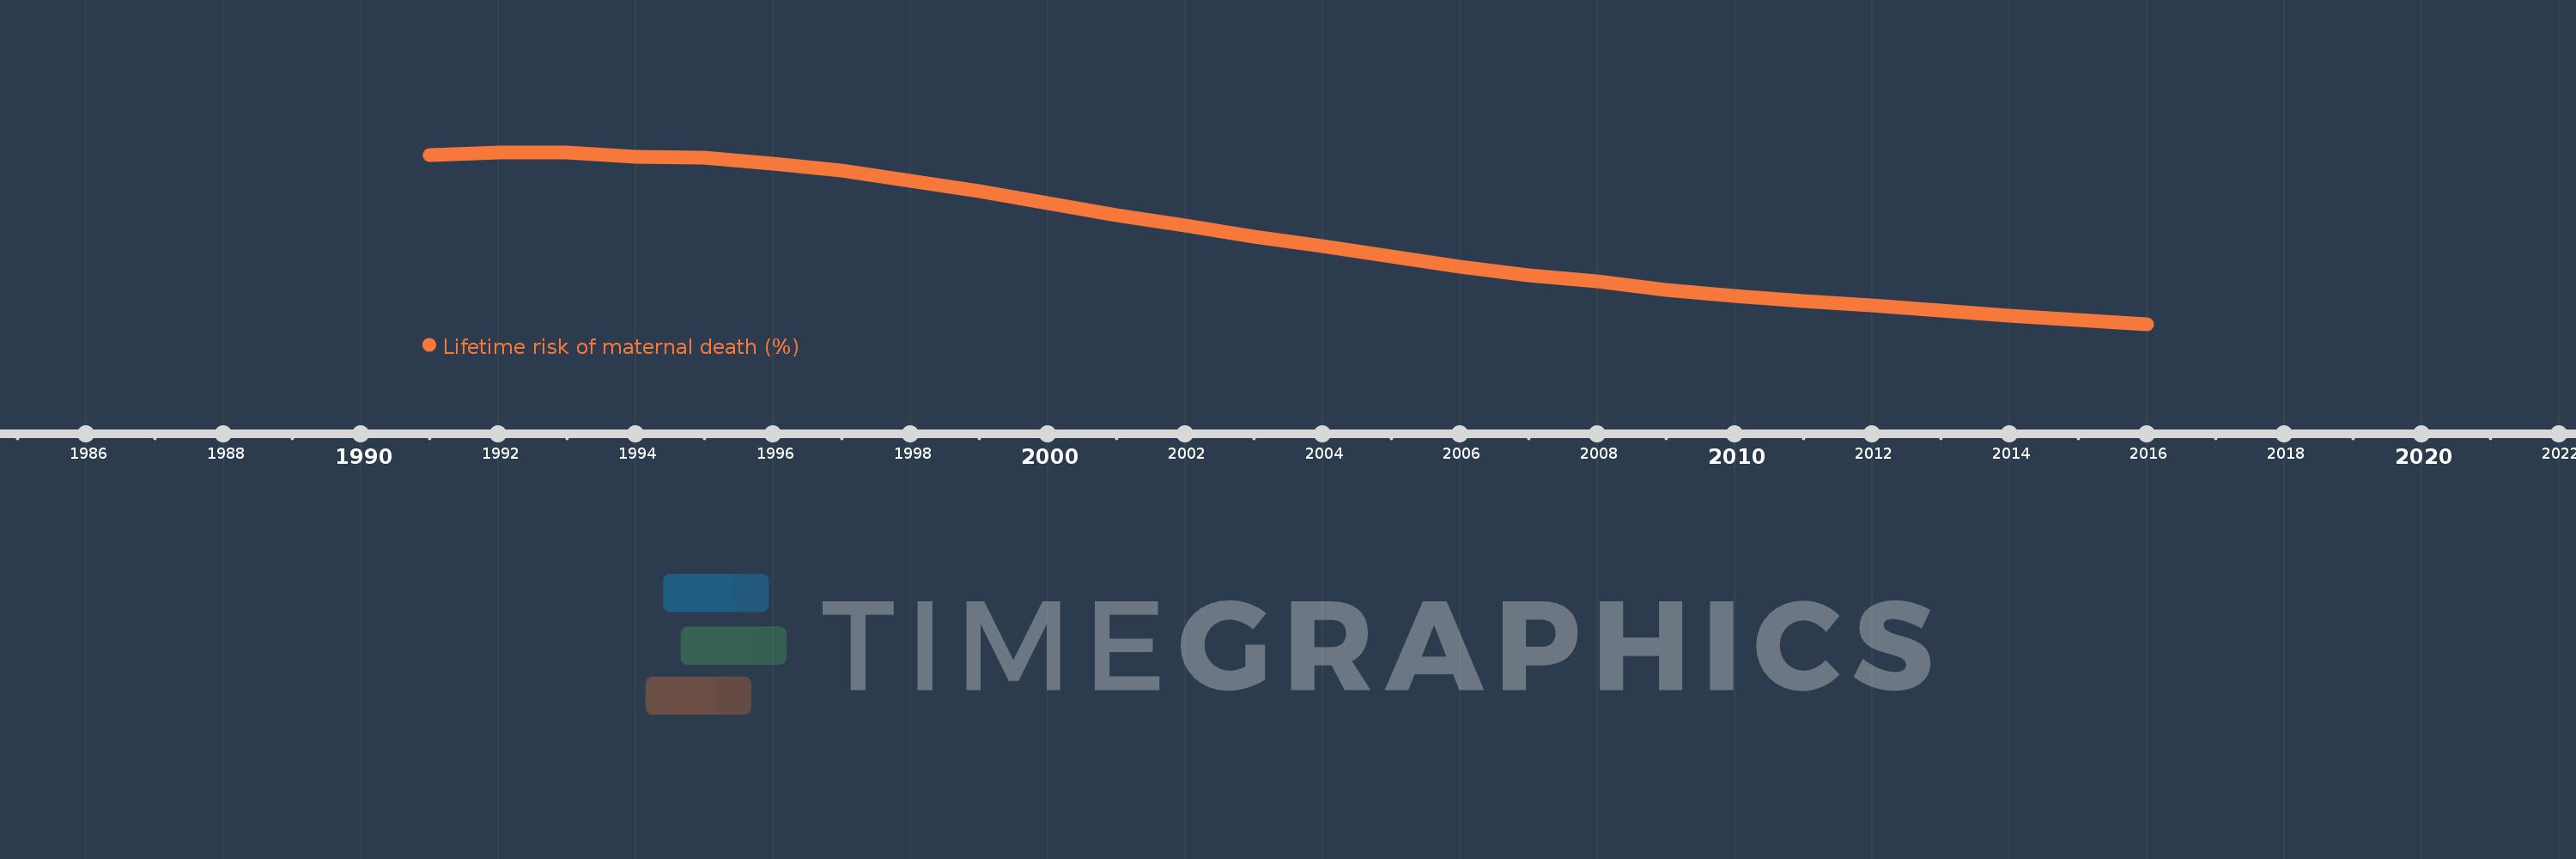
This timeline shows a graph from 1991 to 2016 of Angola. No data until 1990. Number of actual observations by date: 26.
Source name:
World Development Indicators
Source organization:
WHO, UNICEF, UNFPA, The World Bank, and the United Nations Population Division. Trends in Maternal Mortality: 1990 to 2015. Geneva, World Health Organization, 2015
Categories, topics:
Health, Gender
Last updated:
apr 23, 2017
Indicators value changes by year
Meaning:
5.879
Minimum:
3.085
jan 1, 2016
Maximum:
8.558
jan 1, 1993
At the date of observation
Value
Absolute change
Change from the previous value
jan 1, 1991
8.482
+8.482
0.0%
jan 1, 1992
8.55
+0.068
0.8%
jan 1, 1993
8.558
+0.008
0.1%
jan 1, 1994
8.426
-0.133
-1.55%
jan 1, 1995
8.401
-0.025
-0.3%
jan 1, 1996
8.199
-0.201
-2.4%
jan 1, 1997
7.971
-0.228
-2.78%
jan 1, 1998
7.656
-0.316
-3.96%
jan 1, 1999
7.329
-0.327
-4.27%
jan 1, 2000
6.952
-0.376
-5.13%
jan 1, 2001
6.549
-0.404
-5.8%
jan 1, 2002
6.219
-0.329
-5.03%
jan 1, 2003
5.88
-0.34
-5.46%
jan 1, 2004
5.56
-0.32
-5.44%
jan 1, 2005
5.249
-0.311
-5.58%
jan 1, 2006
4.919
-0.331
-6.3%
jan 1, 2007
4.65
-0.269
-5.47%
jan 1, 2008
4.443
-0.207
-4.46%
jan 1, 2009
4.186
-0.256
-5.77%
jan 1, 2010
3.99
-0.196
-4.69%
jan 1, 2011
3.815
-0.175
-4.38%
jan 1, 2012
3.679
-0.136
-3.57%
jan 1, 2013
3.508
-0.171
-4.64%
jan 1, 2014
3.365
-0.144
-4.1%
jan 1, 2015
3.231
-0.133
-3.96%
jan 1, 2016
3.085
-0.146
-4.53%
Ranking of countries by current statistics by years