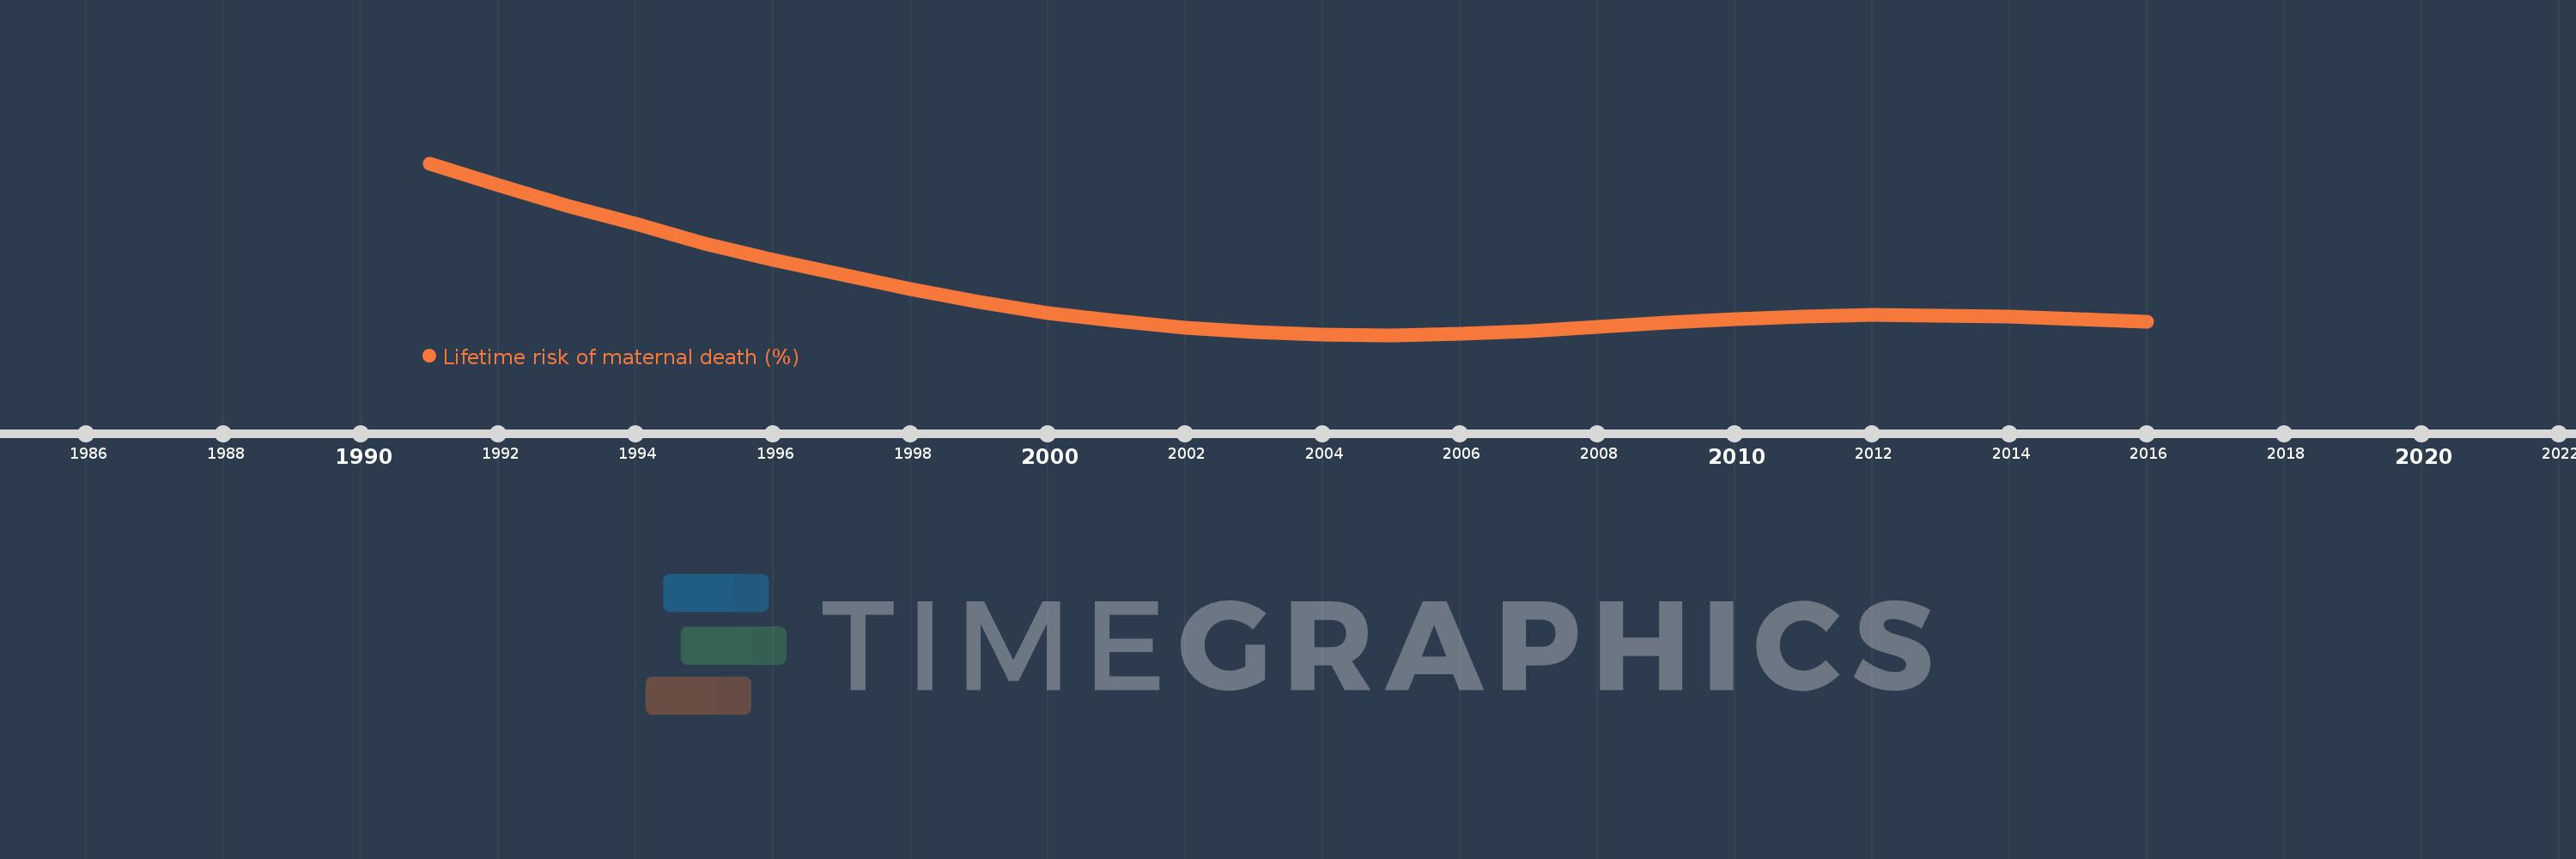
This timeline shows a graph from 1991 to 2016 of Algeria. No data until 1990. Number of actual observations by date: 26.
Source name:
World Development Indicators
Source organization:
WHO, UNICEF, UNFPA, The World Bank, and the United Nations Population Division. Trends in Maternal Mortality: 1990 to 2015. Geneva, World Health Organization, 2015
Categories, topics:
Health, Gender
Last updated:
apr 23, 2017
Indicators value changes by year
Meaning:
0.526
Minimum:
0.369
jan 1, 2005
Maximum:
1.031
jan 1, 1991
At the date of observation
Value
Absolute change
Change from the previous value
jan 1, 1991
1.031
+1.031
0.0%
jan 1, 1992
0.945
-0.086
-8.33%
jan 1, 1993
0.868
-0.077
-8.14%
jan 1, 1994
0.796
-0.072
-8.25%
jan 1, 1995
0.723
-0.074
-9.24%
jan 1, 1996
0.658
-0.064
-8.92%
jan 1, 1997
0.601
-0.057
-8.65%
jan 1, 1998
0.546
-0.056
-9.24%
jan 1, 1999
0.496
-0.05
-9.16%
jan 1, 2000
0.455
-0.041
-8.2%
jan 1, 2001
0.423
-0.032
-6.99%
jan 1, 2002
0.397
-0.026
-6.15%
jan 1, 2003
0.379
-0.019
-4.69%
jan 1, 2004
0.37
-0.009
-2.38%
jan 1, 2005
0.369
0.0
-0.11%
jan 1, 2006
0.374
+0.005
1.25%
jan 1, 2007
0.385
+0.011
2.87%
jan 1, 2008
0.402
+0.017
4.39%
jan 1, 2009
0.418
+0.016
4.06%
jan 1, 2010
0.431
+0.013
3.08%
jan 1, 2011
0.44
+0.009
2.04%
jan 1, 2012
0.446
+0.007
1.56%
jan 1, 2013
0.445
-0.001
-0.28%
jan 1, 2014
0.441
-0.005
-1.04%
jan 1, 2015
0.431
-0.01
-2.23%
jan 1, 2016
0.419
-0.011
-2.63%
Ranking of countries by current statistics by years