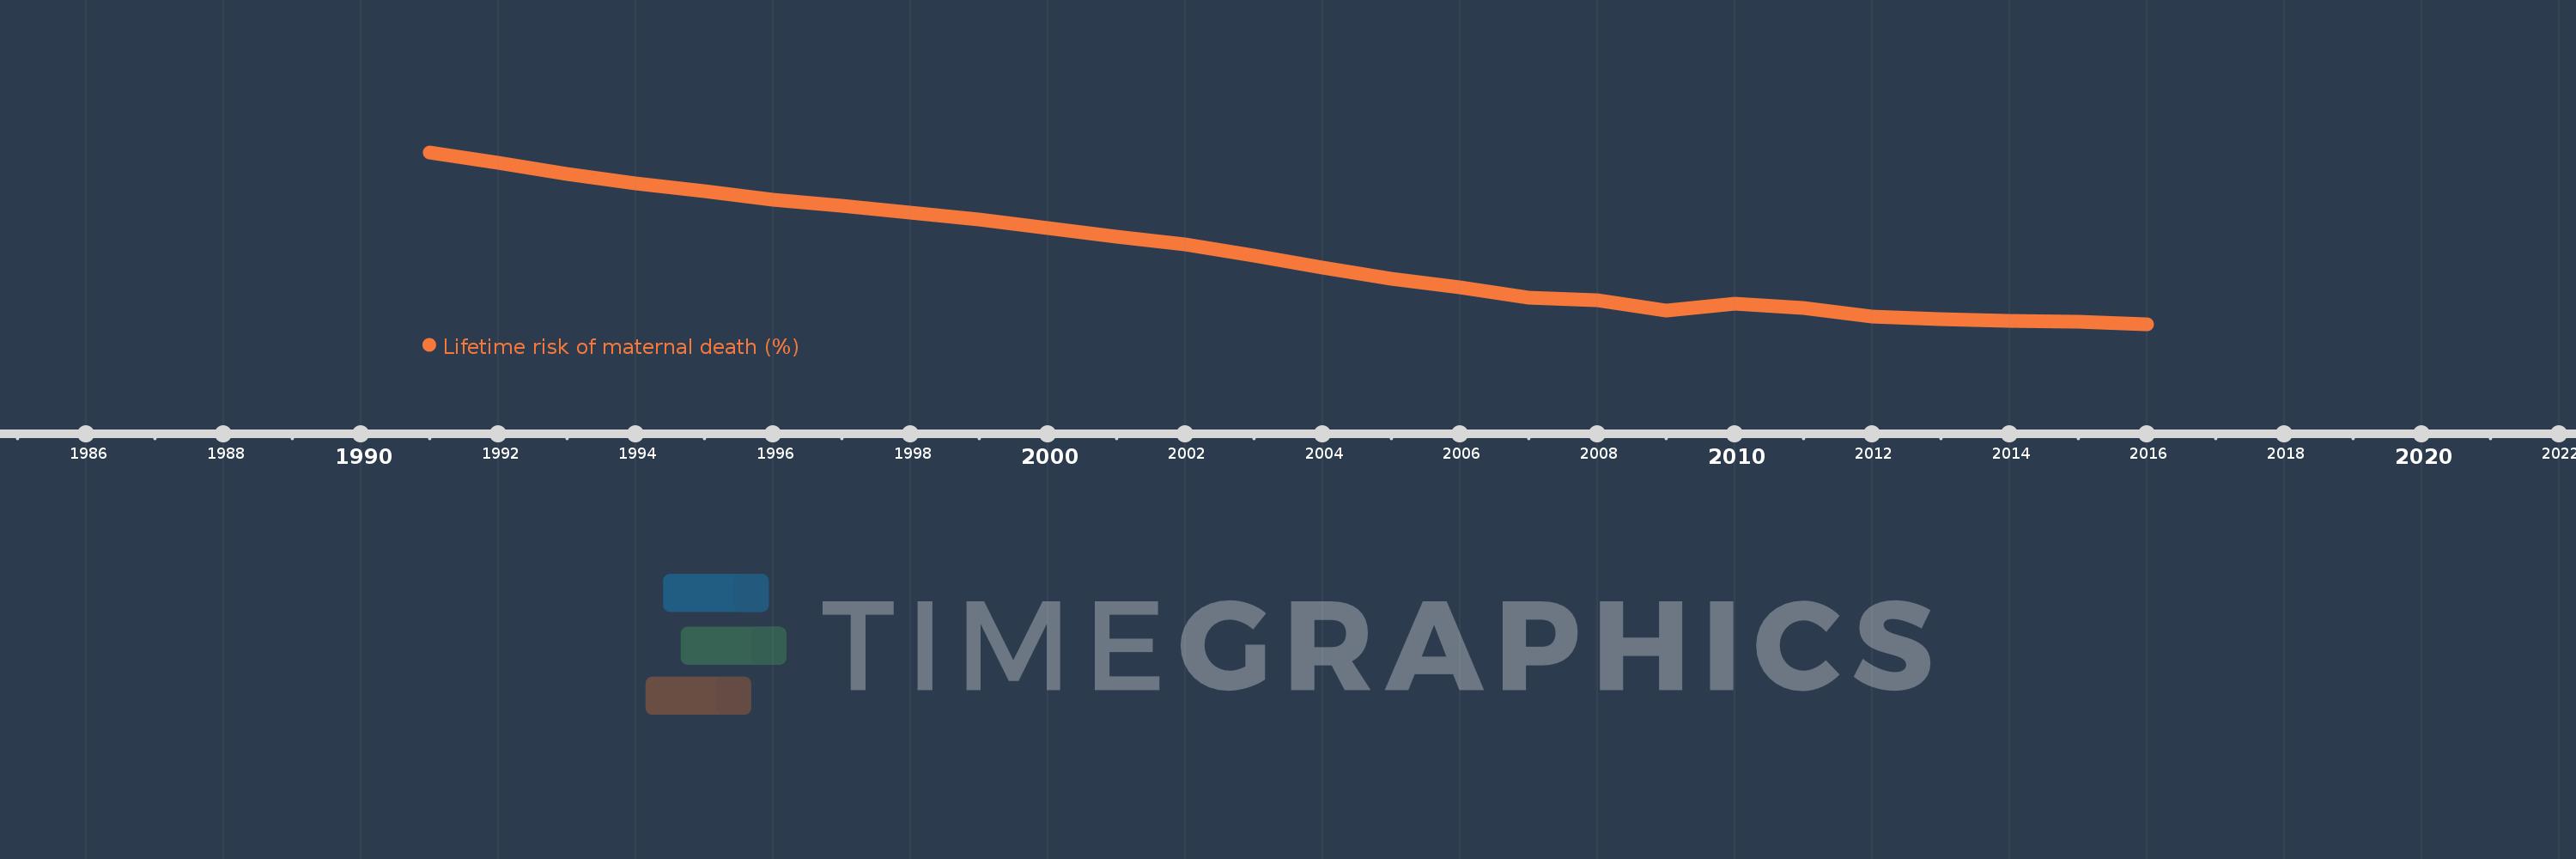
This timeline shows a graph from 1991 to 2016 of IDA blend. No data until 1990. Number of actual observations by date: 26.
Source name:
World Development Indicators
Source organization:
WHO, UNICEF, UNFPA, The World Bank, and the United Nations Population Division. Trends in Maternal Mortality: 1990 to 2015. Geneva, World Health Organization, 2015
Categories, topics:
Health, Gender
Last updated:
apr 23, 2017
Indicators value changes by year
Meaning:
2.512
Minimum:
1.793
jan 1, 2016
Maximum:
3.572
jan 1, 1991
At the date of observation
Value
Absolute change
Change from the previous value
jan 1, 1991
3.572
+3.572
0.0%
jan 1, 1992
3.46
-0.112
-3.13%
jan 1, 1993
3.348
-0.112
-3.23%
jan 1, 1994
3.25
-0.098
-2.93%
jan 1, 1995
3.171
-0.079
-2.44%
jan 1, 1996
3.08
-0.091
-2.88%
jan 1, 1997
3.017
-0.062
-2.02%
jan 1, 1998
2.95
-0.067
-2.23%
jan 1, 1999
2.873
-0.077
-2.62%
jan 1, 2000
2.79
-0.083
-2.88%
jan 1, 2001
2.699
-0.092
-3.28%
jan 1, 2002
2.619
-0.079
-2.94%
jan 1, 2003
2.5
-0.119
-4.54%
jan 1, 2004
2.378
-0.122
-4.89%
jan 1, 2005
2.265
-0.113
-4.76%
jan 1, 2006
2.175
-0.09
-3.99%
jan 1, 2007
2.069
-0.106
-4.87%
jan 1, 2008
2.04
-0.029
-1.39%
jan 1, 2009
1.937
-0.103
-5.05%
jan 1, 2010
2.008
+0.071
3.67%
jan 1, 2011
1.963
-0.045
-2.24%
jan 1, 2012
1.873
-0.09
-4.58%
jan 1, 2013
1.845
-0.029
-1.53%
jan 1, 2014
1.831
-0.013
-0.71%
jan 1, 2015
1.817
-0.015
-0.81%
jan 1, 2016
1.793
-0.024
-1.32%
Ranking of countries by current statistics by years