29
/
en
AIzaSyAYiBZKx7MnpbEhh9jyipgxe19OcubqV5w
April 1, 2024
201810
Morocco
MAR
true
2
1
Lifetime risk of maternal death (%)
2016,2015,2014,2013,2012,2011,2010,2009,2008,2007,2006,2005,2004,2003,2002,2001,2000,1999,1998,1997,1996,1995,1994,1993,1992,1991
Download
Global statistics library →Morocco →

Lifetime risk of maternal death (%)

This statistics in other country:
AfghanistanAlbaniaAlgeriaAngolaArab WorldArgentinaArmeniaAustraliaAustriaAzerbaijanBahamas, TheBahrainBangladeshBarbadosBelarusBelgiumBelizeBeninBhutanBoliviaBosnia and HerzegovinaBotswanaBrazilBrunei DarussalamBulgariaBurkina FasoBurundiCabo VerdeCambodiaCameroonCanadaCaribbean small statesCentral African RepublicCentral Europe and the BalticsChadChileChinaColombiaComorosCongo, Dem. Rep.Congo, Rep.Costa RicaCote d'IvoireCroatiaCubaCyprusCzech RepublicDenmarkDjiboutiDominican RepublicEarly-demographic dividendEast Asia & PacificEast Asia & Pacific (excluding high income)East Asia & Pacific (IDA & IBRD countries)EcuadorEgypt, Arab Rep.El SalvadorEquatorial GuineaEritreaEstoniaEthiopiaEuro areaEurope & Central AsiaEurope & Central Asia (excluding high income)Europe & Central Asia (IDA & IBRD countries)European UnionFijiFinlandFragile and conflict affected situationsFranceGabonGambia, TheGeorgiaGermanyGhanaGreeceGrenadaGuatemalaGuineaGuinea-BissauGuyanaHaitiHeavily indebted poor countries (HIPC)High incomeHondurasHungaryIBRD onlyIcelandIDA & IBRD totalIDA blendIDA onlyIDA totalIndiaIndonesiaIran, Islamic Rep.IraqIrelandIsraelItalyJamaicaJapanJordanKazakhstanKenyaKiribatiKorea, Dem. People’s Rep.Korea, Rep.KuwaitKyrgyz RepublicLao PDRLate-demographic dividendLatin America & Caribbean Latin America & Caribbean (excluding high income)Latin America & the Caribbean (IDA & IBRD countries)LatviaLeast developed countries: UN classificationLebanonLesothoLiberiaLibyaLithuaniaLow & middle incomeLow incomeLower middle incomeLuxembourgMacedonia, FYRMadagascarMalawiMalaysiaMaldivesMaliMaltaMauritaniaMauritiusMexicoMicronesia, Fed. Sts.Middle East & North AfricaMiddle East & North Africa (excluding high income)Middle East & North Africa (IDA & IBRD countries)Middle incomeMoldovaMongoliaMontenegroMoroccoMozambiqueMyanmarNamibiaNepalNetherlandsNew ZealandNicaraguaNigerNigeriaNorth AmericaNorwayOECD membersOmanOther small statesPacific island small statesPakistanPanamaPapua New GuineaParaguayPeruPhilippinesPolandPortugalPost-demographic dividendPre-demographic dividendPuerto RicoQatarRomaniaRussian FederationRwandaSamoaSao Tome and PrincipeSaudi ArabiaSenegalSerbiaSierra LeoneSingaporeSlovak RepublicSloveniaSmall statesSolomon IslandsSomaliaSouth AfricaSouth AsiaSouth Asia (IDA & IBRD)South SudanSpainSri LankaSt. LuciaSt. Vincent and the GrenadinesSub-Saharan Africa Sub-Saharan Africa (excluding high income)Sub-Saharan Africa (IDA & IBRD countries)SudanSurinameSwazilandSwedenSwitzerlandSyrian Arab RepublicTajikistanTanzaniaThailandTimor-LesteTogoTongaTrinidad and TobagoTunisiaTurkeyTurkmenistanUgandaUkraineUnited Arab EmiratesUnited KingdomUnited StatesUpper middle incomeUruguayUzbekistanVanuatuVenezuela, RBVietnamWest Bank and GazaWorldYemen, Rep.ZambiaZimbabwe
Timeline:
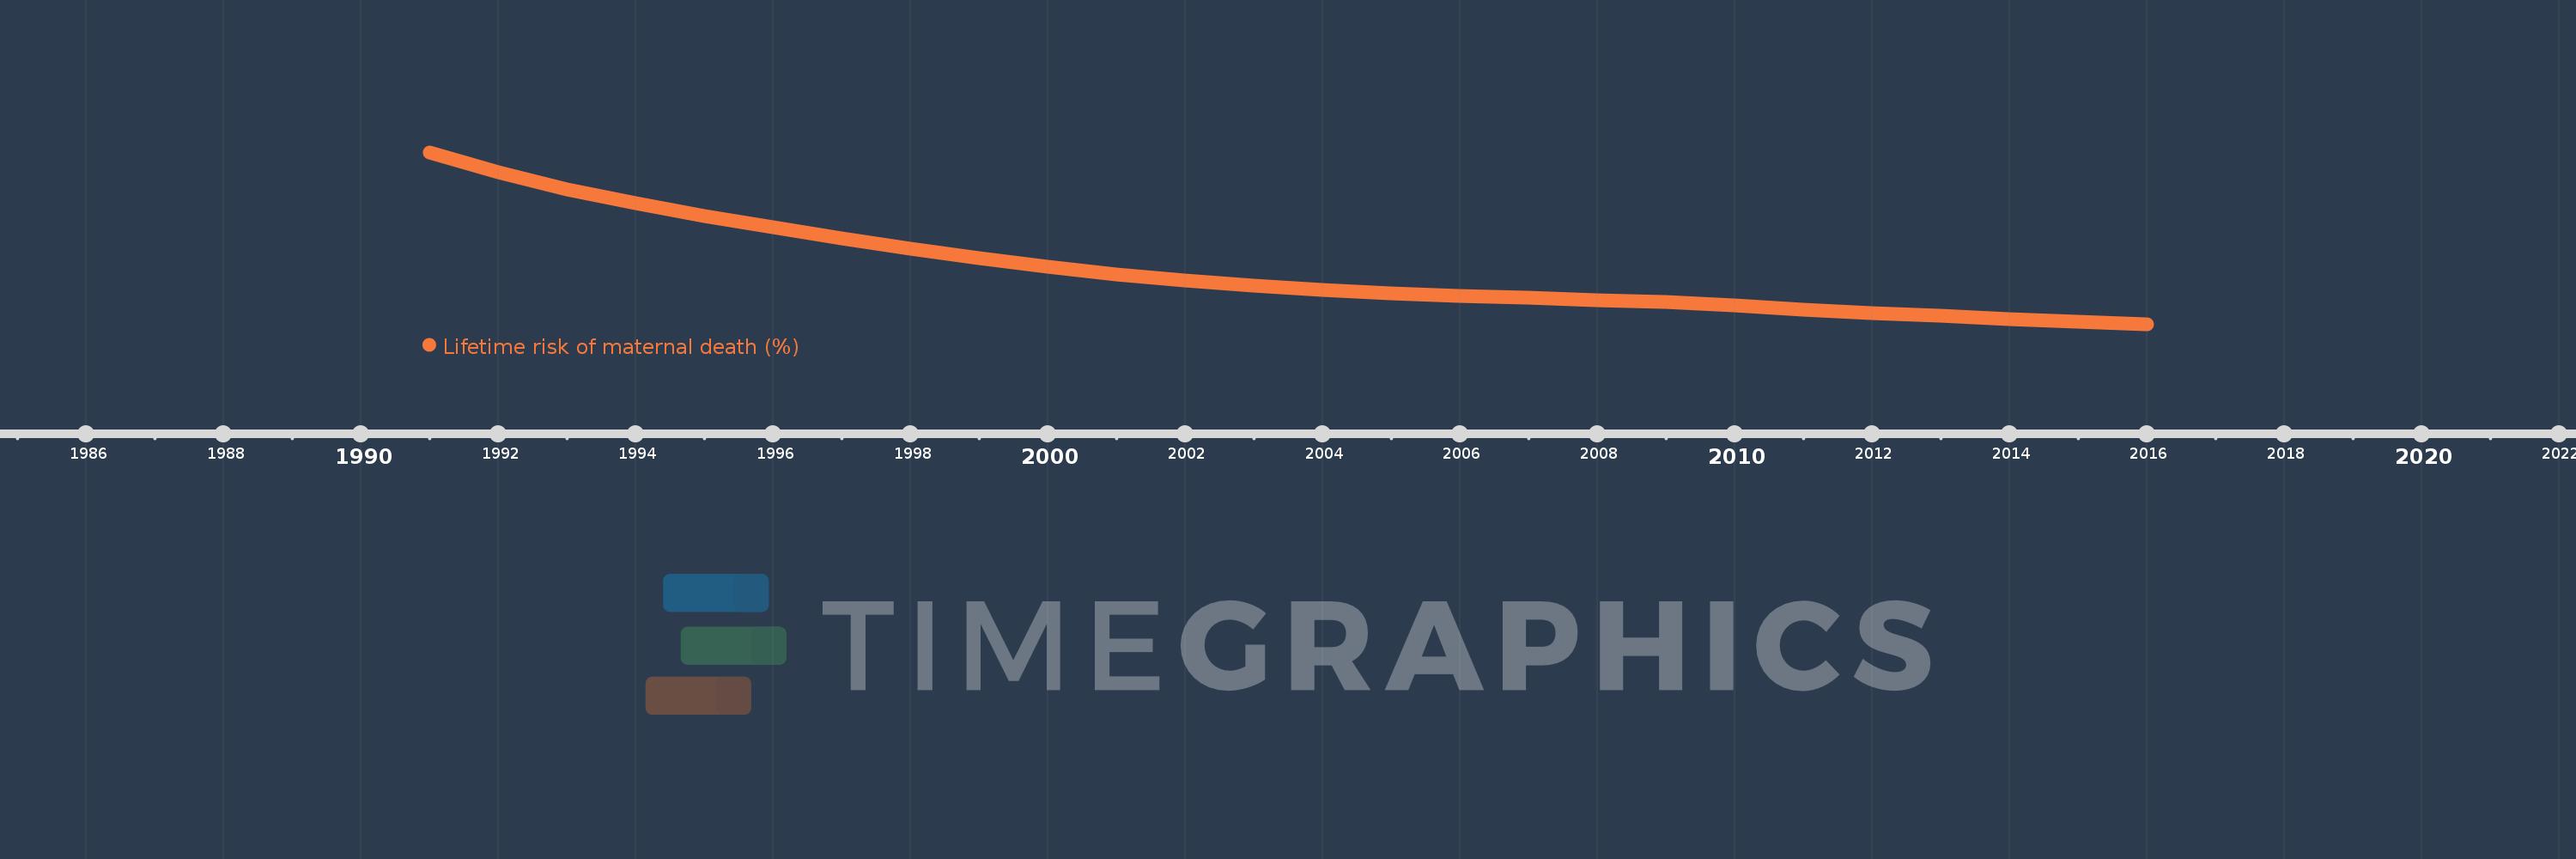
This timeline shows a graph from 1991 to 2016 of Morocco. No data until 1990. Number of actual observations by date: 26.
Source name:
World Development Indicators
Source organization:
WHO, UNICEF, UNFPA, The World Bank, and the United Nations Population Division. Trends in Maternal Mortality: 1990 to 2015. Geneva, World Health Organization, 2015
Categories, topics:
Health, Gender
Last updated:
apr 23, 2017
Indicators value changes by year
Mean:
0.631
Minimum:
0.311
jan 1, 2016
Maximum:
1.311
jan 1, 1991
At the date of observation
Value
Absolute change
Change from previous value
jan 1, 1991
1.311
+1.311
0.0%
jan 1, 1992
1.196
-0.115
-8.75%
jan 1, 1993
1.098
-0.098
-8.21%
jan 1, 1994
1.015
-0.083
-7.6%
jan 1, 1995
0.942
-0.073
-7.18%
jan 1, 1996
0.875
-0.067
-7.14%
jan 1, 1997
0.81
-0.065
-7.41%
jan 1, 1998
0.751
-0.059
-7.26%
jan 1, 1999
0.696
-0.055
-7.35%
jan 1, 2000
0.645
-0.051
-7.3%
jan 1, 2001
0.601
-0.044
-6.75%
jan 1, 2002
0.565
-0.037
-6.1%
jan 1, 2003
0.534
-0.031
-5.45%
jan 1, 2004
0.51
-0.024
-4.47%
jan 1, 2005
0.493
-0.017
-3.38%
jan 1, 2006
0.477
-0.015
-3.13%
jan 1, 2007
0.465
-0.012
-2.62%
jan 1, 2008
0.452
-0.012
-2.68%
jan 1, 2009
0.439
-0.014
-3.03%
jan 1, 2010
0.422
-0.017
-3.89%
jan 1, 2011
0.397
-0.025
-5.9%
jan 1, 2012
0.376
-0.021
-5.31%
jan 1, 2013
0.359
-0.017
-4.47%
jan 1, 2014
0.343
-0.016
-4.52%
jan 1, 2015
0.327
-0.015
-4.47%
jan 1, 2016
0.311
-0.016
-4.89%
Ranking of countries by current statistics by years

Comments:

Send
PremiumAbout & FeedbackTermsPrivacy
logo
© 2022 Selected Technologies LLC – Morgan Hill, California