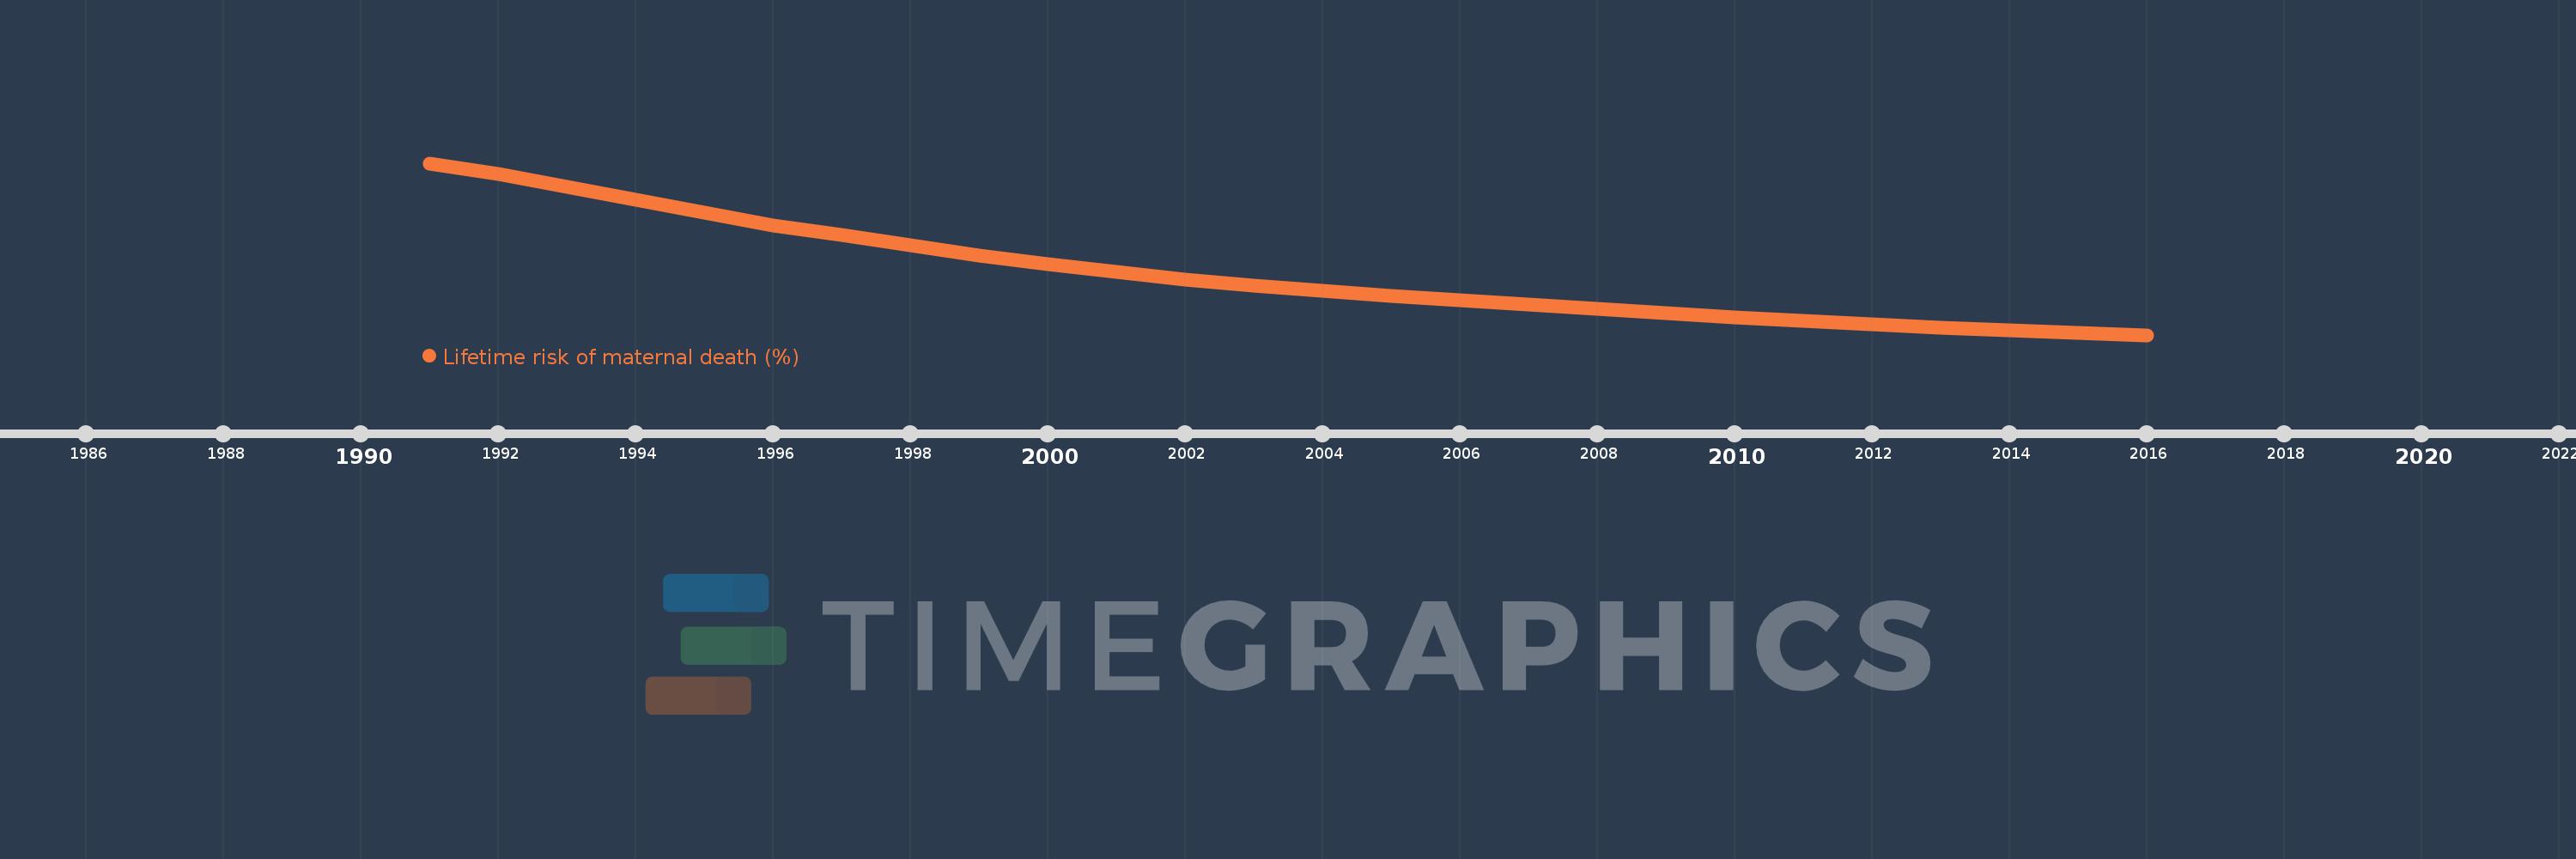
This timeline shows a graph from 1991 to 2016 of Lao PDR. No data until 1990. Number of actual observations by date: 26.
Source name:
World Development Indicators
Source organization:
WHO, UNICEF, UNFPA, The World Bank, and the United Nations Population Division. Trends in Maternal Mortality: 1990 to 2015. Geneva, World Health Organization, 2015
Categories, topics:
Health, Gender
Last updated:
apr 23, 2017
Indicators value changes by year
Meaning:
2.433
Minimum:
0.665
jan 1, 2016
Maximum:
5.571
jan 1, 1991
At the date of observation
Value
Absolute change
Change from the previous value
jan 1, 1991
5.571
+5.571
0.0%
jan 1, 1992
5.255
-0.316
-5.67%
jan 1, 1993
4.9
-0.356
-6.77%
jan 1, 1994
4.523
-0.376
-7.68%
jan 1, 1995
4.163
-0.36
-7.96%
jan 1, 1996
3.804
-0.359
-8.63%
jan 1, 1997
3.512
-0.292
-7.67%
jan 1, 1998
3.217
-0.295
-8.41%
jan 1, 1999
2.944
-0.273
-8.48%
jan 1, 2000
2.69
-0.254
-8.64%
jan 1, 2001
2.466
-0.224
-8.33%
jan 1, 2002
2.259
-0.207
-8.38%
jan 1, 2003
2.084
-0.176
-7.78%
jan 1, 2004
1.928
-0.155
-7.45%
jan 1, 2005
1.788
-0.14
-7.28%
jan 1, 2006
1.654
-0.134
-7.52%
jan 1, 2007
1.526
-0.127
-7.7%
jan 1, 2008
1.403
-0.124
-8.1%
jan 1, 2009
1.285
-0.117
-8.35%
jan 1, 2010
1.173
-0.112
-8.75%
jan 1, 2011
1.071
-0.102
-8.73%
jan 1, 2012
0.973
-0.097
-9.07%
jan 1, 2013
0.883
-0.09
-9.28%
jan 1, 2014
0.799
-0.084
-9.55%
jan 1, 2015
0.728
-0.071
-8.85%
jan 1, 2016
0.665
-0.063
-8.66%
Ranking of countries by current statistics by years