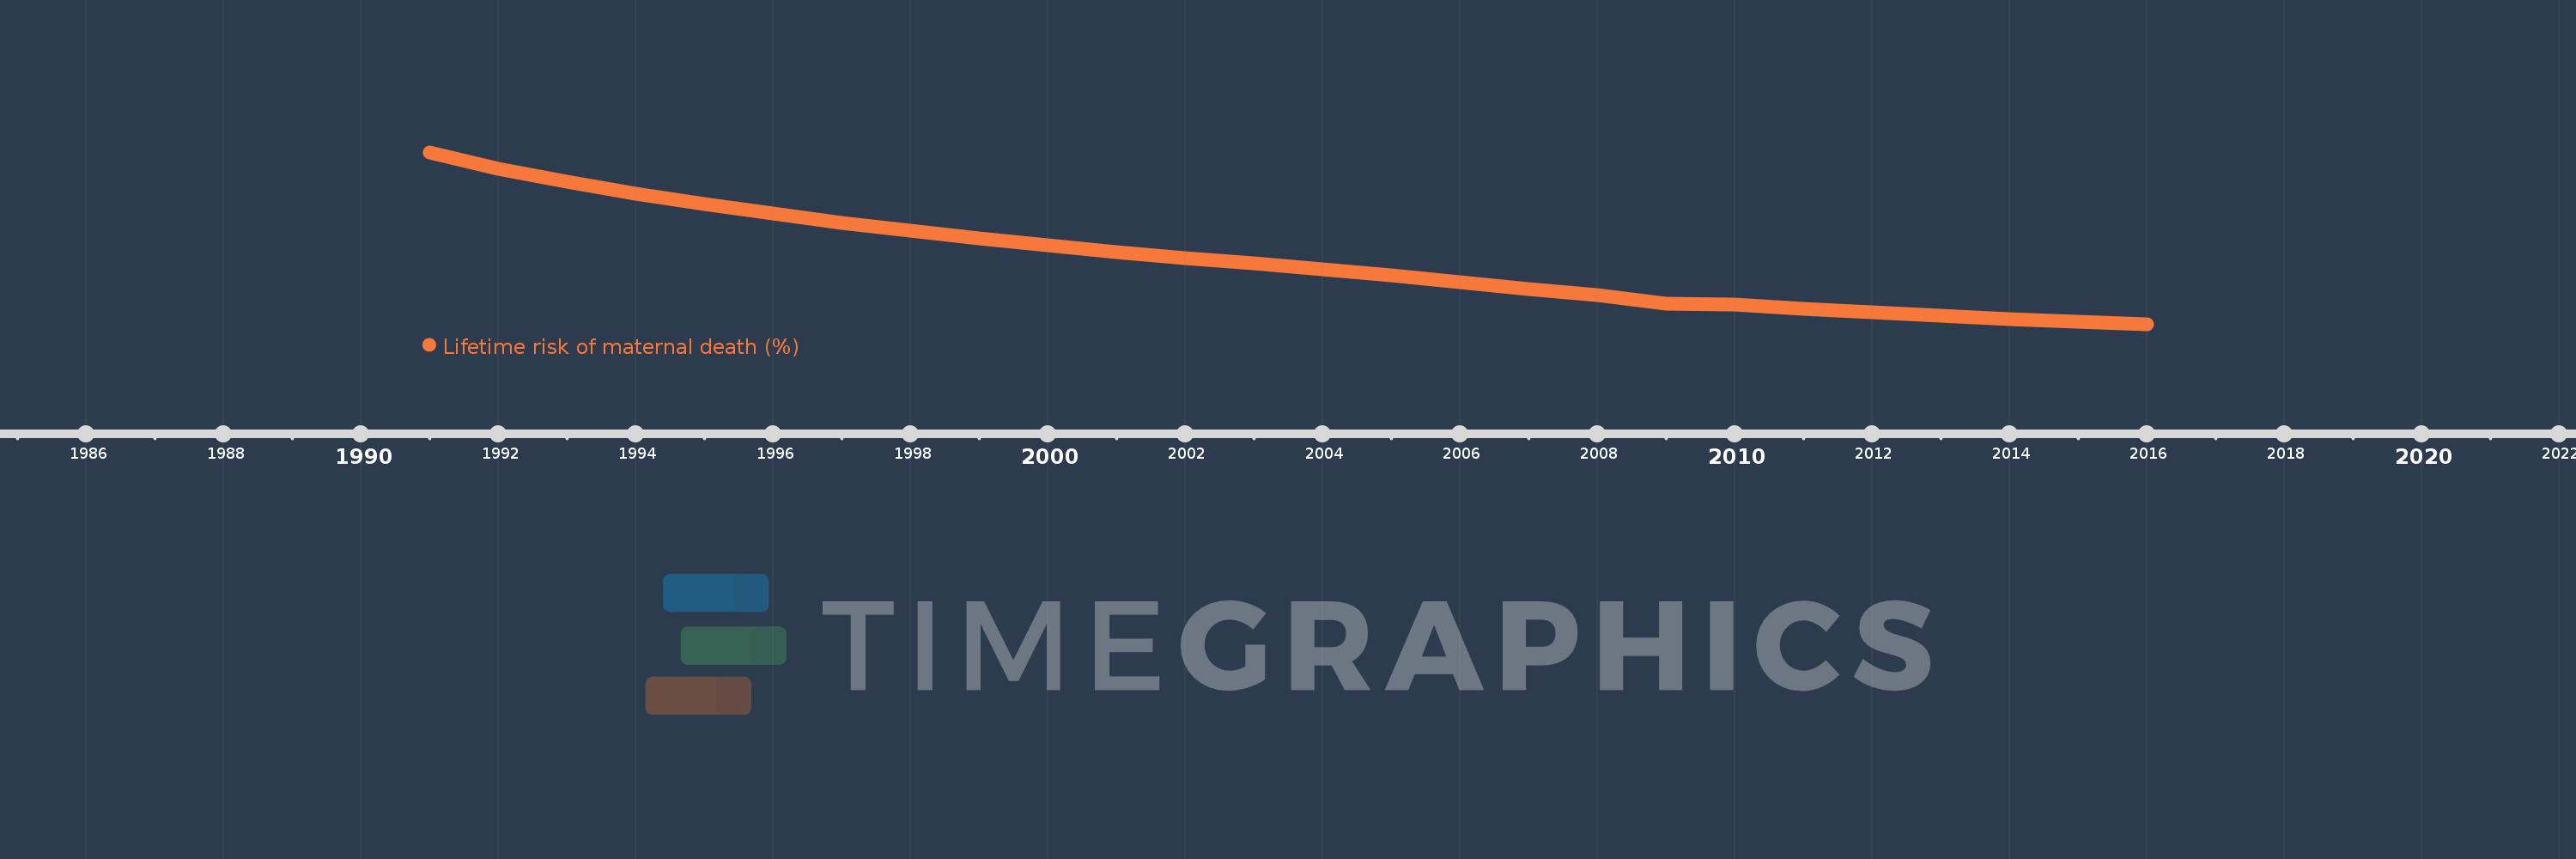
This timeline shows a graph from 1991 to 2016 of Myanmar. No data until 1990. Number of actual observations by date: 26.
Source name:
World Development Indicators
Source organization:
WHO, UNICEF, UNFPA, The World Bank, and the United Nations Population Division. Trends in Maternal Mortality: 1990 to 2015. Geneva, World Health Organization, 2015
Categories, topics:
Health, Gender
Last updated:
apr 23, 2017
Indicators value changes by year
Meaning:
0.836
Minimum:
0.385
jan 1, 2016
Maximum:
1.582
jan 1, 1991
At the date of observation
Value
Absolute change
Change from the previous value
jan 1, 1991
1.582
+1.582
0.0%
jan 1, 1992
1.47
-0.112
-7.06%
jan 1, 1993
1.377
-0.093
-6.35%
jan 1, 1994
1.293
-0.084
-6.09%
jan 1, 1995
1.22
-0.073
-5.62%
jan 1, 1996
1.154
-0.066
-5.44%
jan 1, 1997
1.093
-0.062
-5.33%
jan 1, 1998
1.037
-0.055
-5.06%
jan 1, 1999
0.982
-0.055
-5.34%
jan 1, 2000
0.933
-0.049
-5.0%
jan 1, 2001
0.886
-0.047
-4.99%
jan 1, 2002
0.848
-0.038
-4.27%
jan 1, 2003
0.807
-0.042
-4.92%
jan 1, 2004
0.766
-0.041
-5.05%
jan 1, 2005
0.723
-0.043
-5.6%
jan 1, 2006
0.675
-0.048
-6.7%
jan 1, 2007
0.632
-0.043
-6.31%
jan 1, 2008
0.59
-0.042
-6.6%
jan 1, 2009
0.531
-0.059
-9.98%
jan 1, 2010
0.52
-0.011
-2.14%
jan 1, 2011
0.494
-0.026
-5.07%
jan 1, 2012
0.47
-0.024
-4.77%
jan 1, 2013
0.445
-0.025
-5.38%
jan 1, 2014
0.422
-0.023
-5.13%
jan 1, 2015
0.403
-0.019
-4.62%
jan 1, 2016
0.385
-0.018
-4.41%
Ranking of countries by current statistics by years