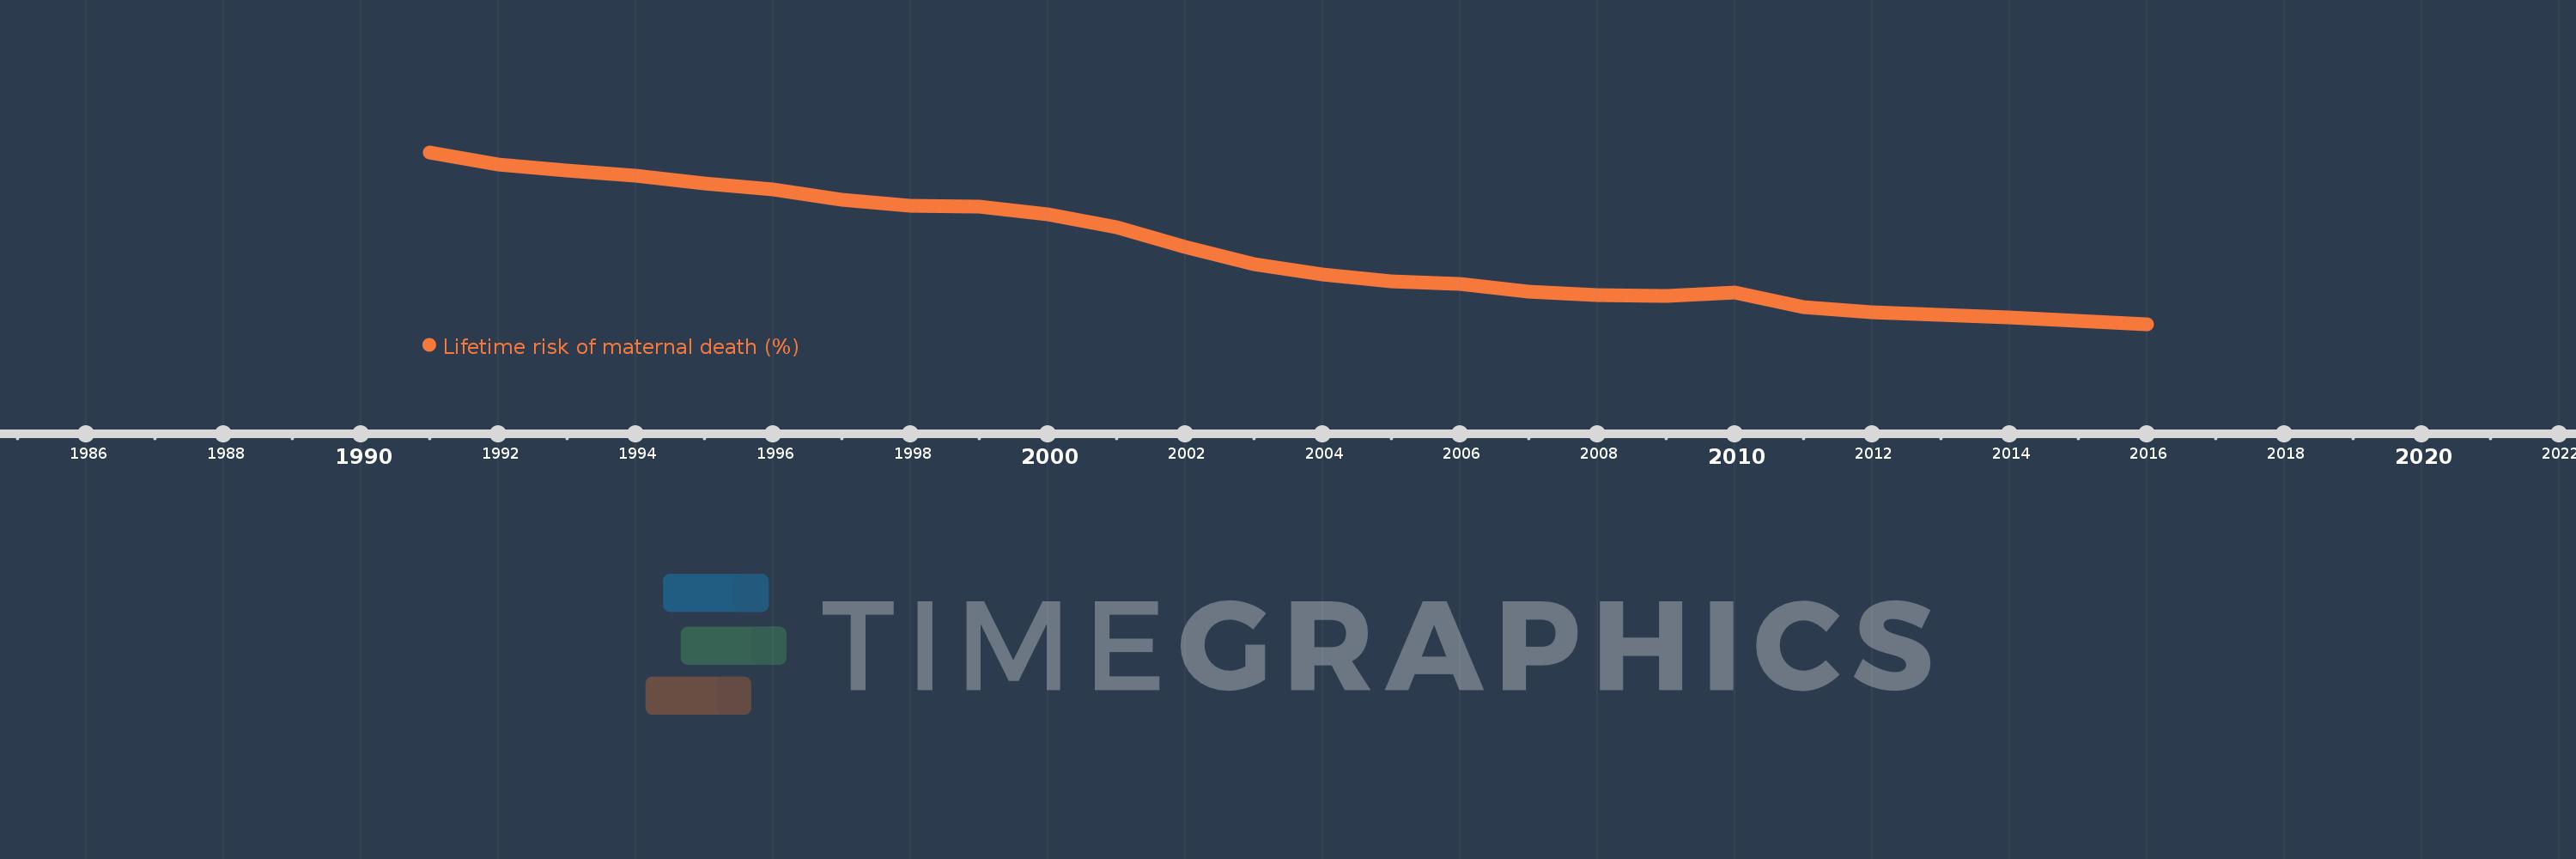
This timeline shows a graph from 1991 to 2016 of Mexico. No data until 1990. Number of actual observations by date: 26.
Source name:
World Development Indicators
Source organization:
WHO, UNICEF, UNFPA, The World Bank, and the United Nations Population Division. Trends in Maternal Mortality: 1990 to 2015. Geneva, World Health Organization, 2015
Categories, topics:
Health, Gender
Last updated:
apr 23, 2017
Indicators value changes by year
Meaning:
0.204
Minimum:
0.089
jan 1, 2016
Maximum:
0.357
jan 1, 1991
At the date of observation
Value
Absolute change
Change from the previous value
jan 1, 1991
0.357
+0.357
0.0%
jan 1, 1992
0.338
-0.018
-5.07%
jan 1, 1993
0.329
-0.01
-2.81%
jan 1, 1994
0.321
-0.008
-2.39%
jan 1, 1995
0.308
-0.013
-3.94%
jan 1, 1996
0.299
-0.01
-3.13%
jan 1, 1997
0.283
-0.015
-5.17%
jan 1, 1998
0.274
-0.009
-3.14%
jan 1, 1999
0.273
-0.001
-0.38%
jan 1, 2000
0.261
-0.012
-4.4%
jan 1, 2001
0.24
-0.021
-8.11%
jan 1, 2002
0.21
-0.03
-12.43%
jan 1, 2003
0.183
-0.027
-12.79%
jan 1, 2004
0.167
-0.016
-8.85%
jan 1, 2005
0.156
-0.011
-6.77%
jan 1, 2006
0.152
-0.004
-2.69%
jan 1, 2007
0.14
-0.011
-7.57%
jan 1, 2008
0.135
-0.005
-3.55%
jan 1, 2009
0.133
-0.003
-1.93%
jan 1, 2010
0.138
+0.005
4.14%
jan 1, 2011
0.116
-0.022
-15.99%
jan 1, 2012
0.107
-0.009
-7.99%
jan 1, 2013
0.104
-0.003
-2.98%
jan 1, 2014
0.1
-0.003
-3.03%
jan 1, 2015
0.094
-0.007
-6.63%
jan 1, 2016
0.089
-0.005
-5.22%
Ranking of countries by current statistics by years