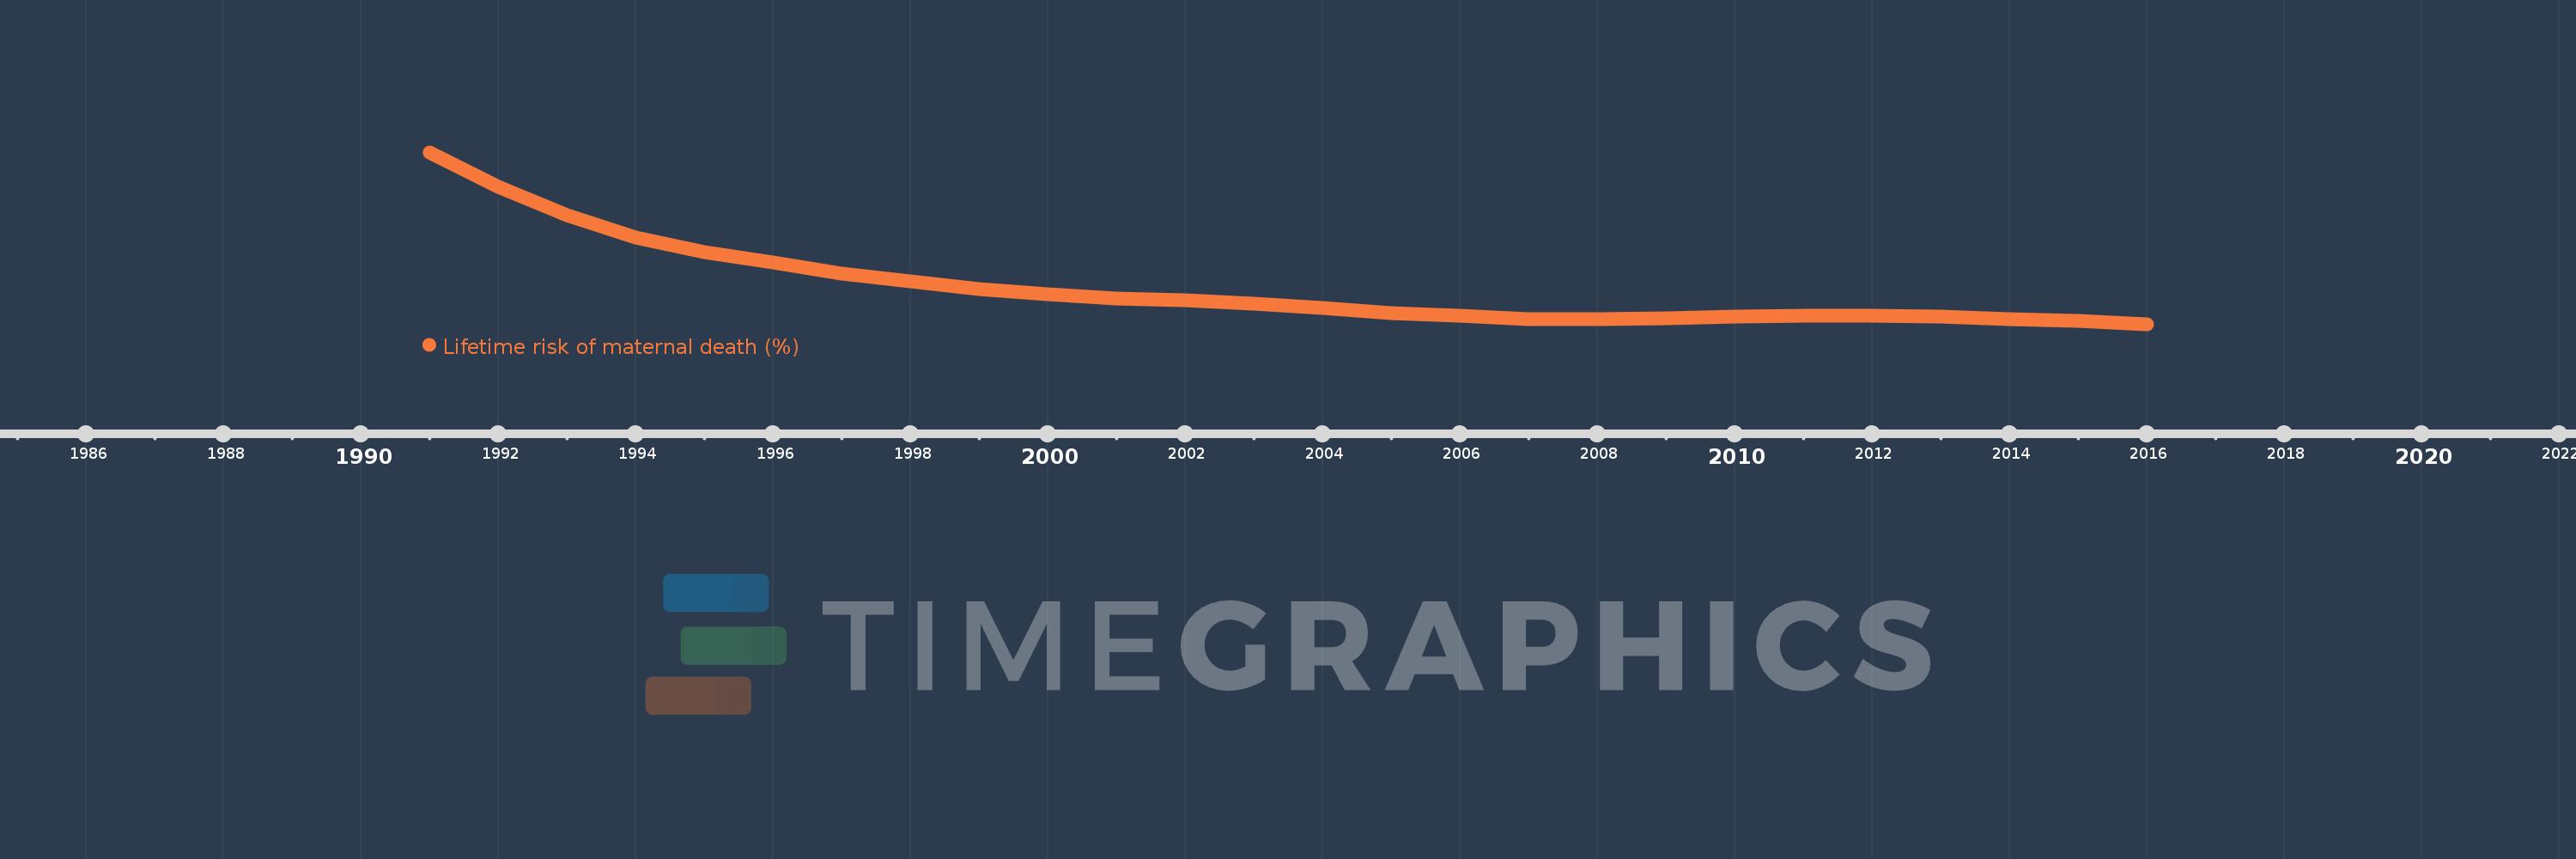
This timeline shows a graph from 1991 to 2016 of Oman. No data until 1990. Number of actual observations by date: 26.
Source name:
World Development Indicators
Source organization:
WHO, UNICEF, UNFPA, The World Bank, and the United Nations Population Division. Trends in Maternal Mortality: 1990 to 2015. Geneva, World Health Organization, 2015
Categories, topics:
Health, Gender
Last updated:
apr 23, 2017
Indicators value changes by year
Meaning:
0.089
Minimum:
0.054
jan 1, 2016
Maximum:
0.219
jan 1, 1991
At the date of observation
Value
Absolute change
Change from the previous value
jan 1, 1991
0.219
+0.219
0.0%
jan 1, 1992
0.186
-0.033
-15.02%
jan 1, 1993
0.159
-0.027
-14.66%
jan 1, 1994
0.137
-0.021
-13.45%
jan 1, 1995
0.123
-0.014
-10.2%
jan 1, 1996
0.113
-0.011
-8.73%
jan 1, 1997
0.103
-0.01
-8.63%
jan 1, 1998
0.095
-0.008
-8.14%
jan 1, 1999
0.088
-0.007
-7.2%
jan 1, 2000
0.083
-0.005
-5.84%
jan 1, 2001
0.079
-0.004
-4.75%
jan 1, 2002
0.077
-0.002
-2.53%
jan 1, 2003
0.074
-0.003
-4.21%
jan 1, 2004
0.07
-0.004
-5.43%
jan 1, 2005
0.065
-0.004
-5.87%
jan 1, 2006
0.062
-0.003
-4.6%
jan 1, 2007
0.059
-0.003
-4.89%
jan 1, 2008
0.059
-0.001
-0.88%
jan 1, 2009
0.06
+0.001
1.37%
jan 1, 2010
0.061
+0.001
1.44%
jan 1, 2011
0.062
+0.002
3.2%
jan 1, 2012
0.062
0.0
-0.56%
jan 1, 2013
0.061
-0.001
-1.92%
jan 1, 2014
0.059
-0.002
-3.26%
jan 1, 2015
0.057
-0.002
-4.1%
jan 1, 2016
0.054
-0.003
-4.53%
Ranking of countries by current statistics by years