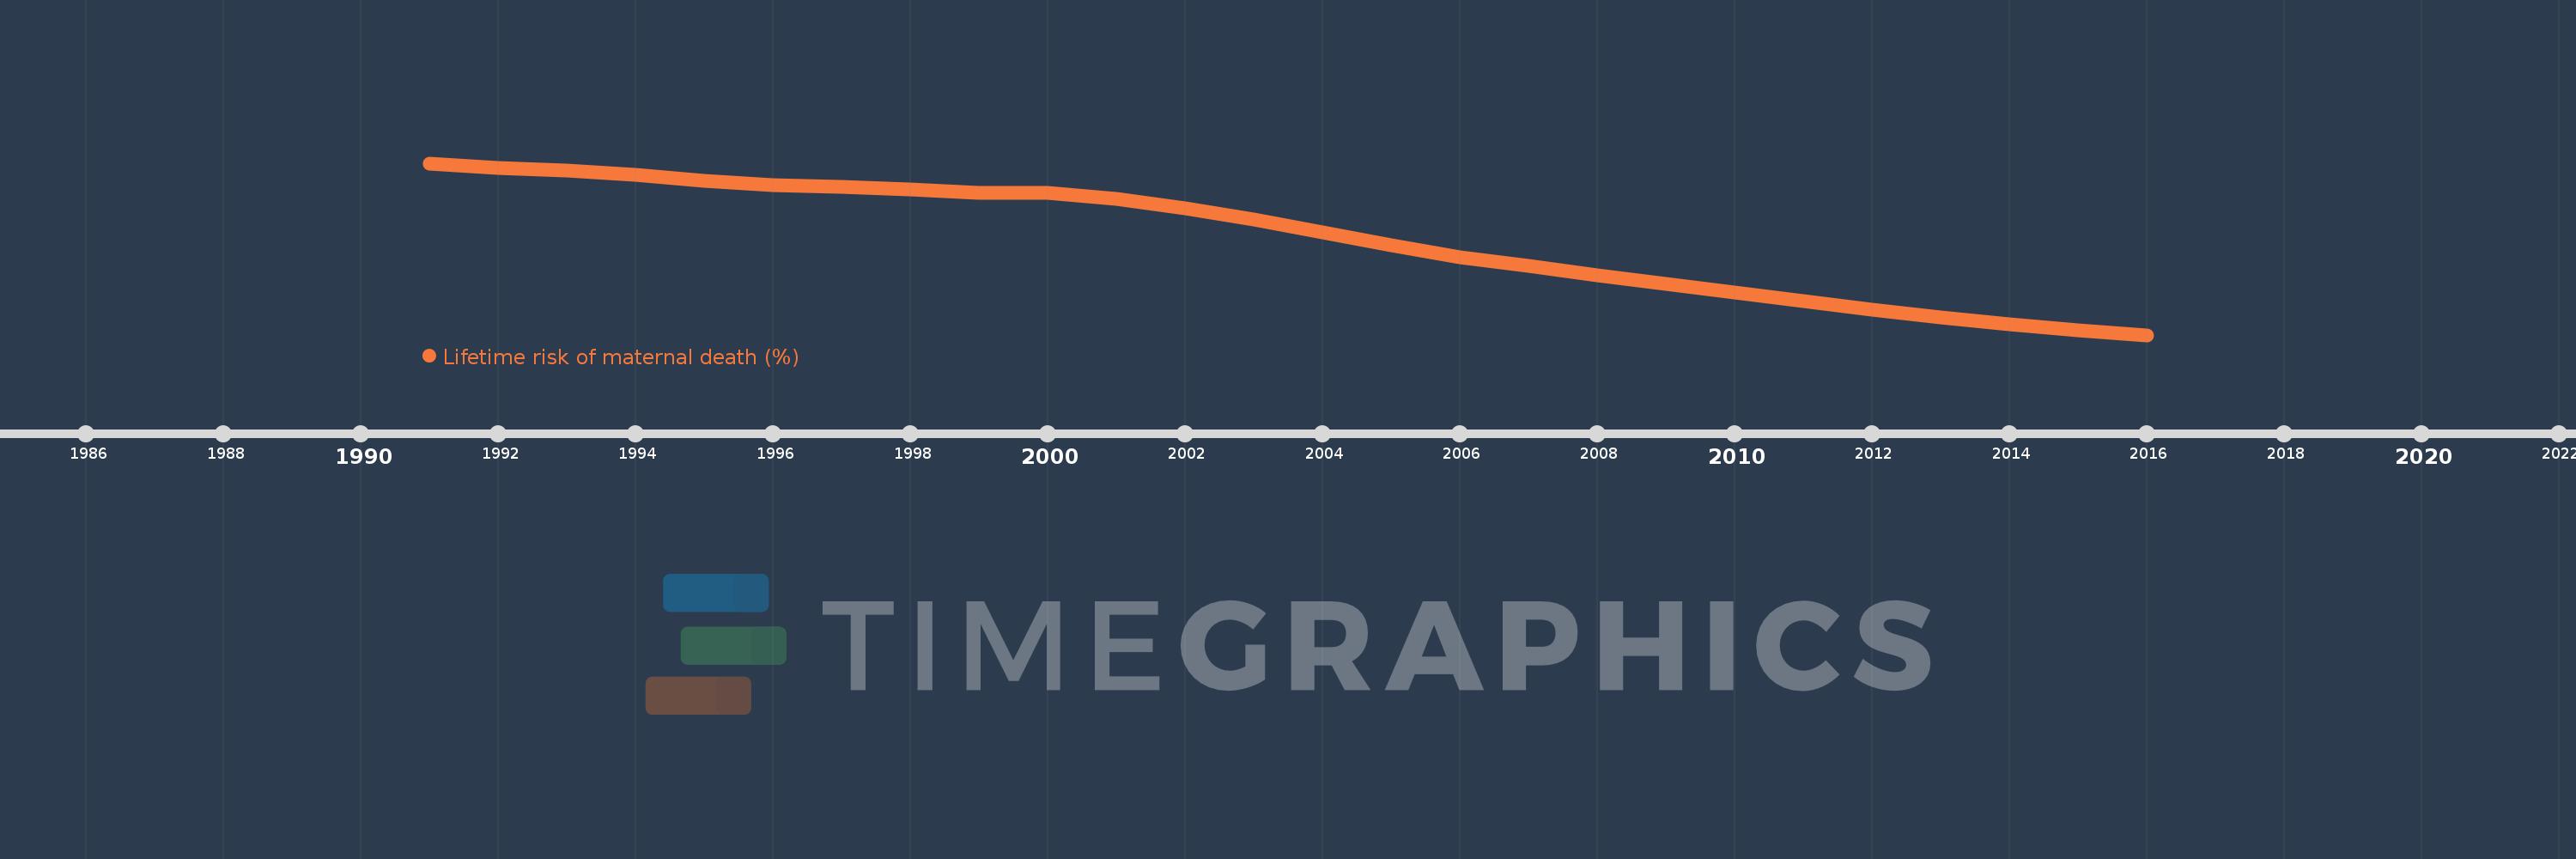
This timeline shows a graph from 1991 to 2016 of Afghanistan. No data until 1990. Number of actual observations by date: 26.
Source name:
World Development Indicators
Source organization:
WHO, UNICEF, UNFPA, The World Bank, and the United Nations Population Division. Trends in Maternal Mortality: 1990 to 2015. Geneva, World Health Organization, 2015
Categories, topics:
Health, Gender
Last updated:
apr 23, 2017
Indicators value changes by year
Meaning:
6.511
Minimum:
1.926
jan 1, 2016
Maximum:
10.087
jan 1, 1991
At the date of observation
Value
Absolute change
Change from the previous value
jan 1, 1991
10.087
+10.087
0.0%
jan 1, 1992
9.871
-0.216
-2.15%
jan 1, 1993
9.73
-0.14
-1.42%
jan 1, 1994
9.523
-0.207
-2.13%
jan 1, 1995
9.239
-0.284
-2.98%
jan 1, 1996
9.051
-0.188
-2.04%
jan 1, 1997
8.953
-0.098
-1.08%
jan 1, 1998
8.843
-0.109
-1.22%
jan 1, 1999
8.683
-0.16
-1.81%
jan 1, 2000
8.667
-0.017
-0.19%
jan 1, 2001
8.408
-0.259
-2.98%
jan 1, 2002
7.962
-0.446
-5.31%
jan 1, 2003
7.396
-0.565
-7.1%
jan 1, 2004
6.808
-0.588
-7.95%
jan 1, 2005
6.198
-0.61
-8.96%
jan 1, 2006
5.624
-0.575
-9.27%
jan 1, 2007
5.216
-0.408
-7.25%
jan 1, 2008
4.769
-0.447
-8.57%
jan 1, 2009
4.364
-0.405
-8.5%
jan 1, 2010
3.962
-0.402
-9.2%
jan 1, 2011
3.543
-0.419
-10.57%
jan 1, 2012
3.119
-0.425
-11.98%
jan 1, 2013
2.75
-0.368
-11.81%
jan 1, 2014
2.435
-0.316
-11.47%
jan 1, 2015
2.153
-0.281
-11.56%
jan 1, 2016
1.926
-0.227
-10.55%
Ranking of countries by current statistics by years