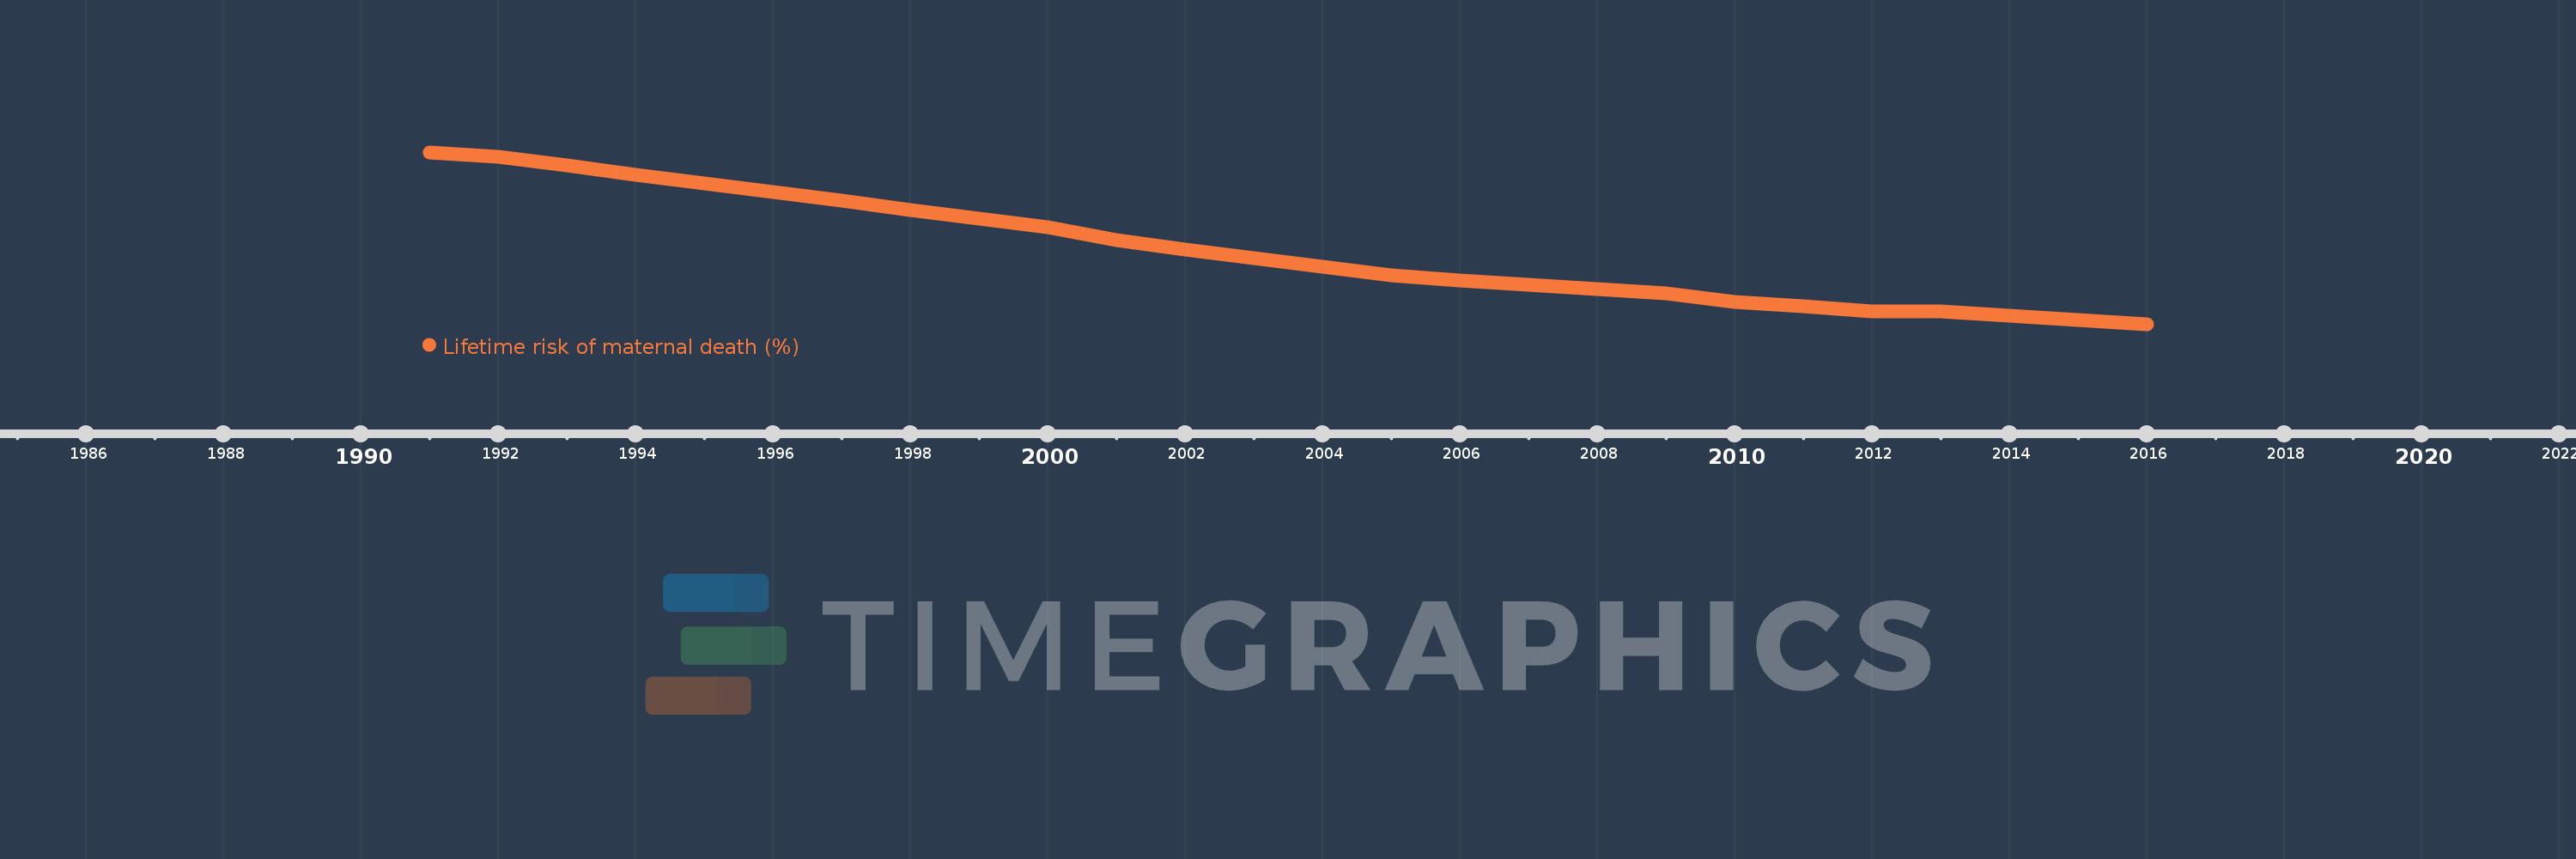
This timeline shows a graph from 1991 to 2016 of Puerto Rico. No data until 1990. Number of actual observations by date: 26.
Source name:
World Development Indicators
Source organization:
WHO, UNICEF, UNFPA, The World Bank, and the United Nations Population Division. Trends in Maternal Mortality: 1990 to 2015. Geneva, World Health Organization, 2015
Categories, topics:
Health, Gender
Last updated:
apr 23, 2017
Indicators value changes by year
Meaning:
0.04
Minimum:
0.023
jan 1, 2016
Maximum:
0.062
jan 1, 1991
At the date of observation
Value
Absolute change
Change from the previous value
jan 1, 1991
0.062
+0.062
0.0%
jan 1, 1992
0.061
-0.002
-2.56%
jan 1, 1993
0.059
-0.002
-2.9%
jan 1, 1994
0.057
-0.002
-3.12%
jan 1, 1995
0.055
-0.002
-3.53%
jan 1, 1996
0.053
-0.002
-3.55%
jan 1, 1997
0.051
-0.002
-4.07%
jan 1, 1998
0.049
-0.002
-4.08%
jan 1, 1999
0.047
-0.002
-4.05%
jan 1, 2000
0.045
-0.002
-4.78%
jan 1, 2001
0.042
-0.002
-4.98%
jan 1, 2002
0.04
-0.002
-5.53%
jan 1, 2003
0.038
-0.002
-5.27%
jan 1, 2004
0.036
-0.002
-4.61%
jan 1, 2005
0.034
-0.002
-4.55%
jan 1, 2006
0.033
-0.001
-4.0%
jan 1, 2007
0.032
-0.001
-3.97%
jan 1, 2008
0.031
-0.001
-3.71%
jan 1, 2009
0.03
-0.001
-3.42%
jan 1, 2010
0.028
-0.001
-3.72%
jan 1, 2011
0.027
-0.001
-3.91%
jan 1, 2012
0.026
-0.001
-3.51%
jan 1, 2013
0.026
-0.001
-3.31%
jan 1, 2014
0.025
-0.001
-3.02%
jan 1, 2015
0.024
-0.001
-2.53%
jan 1, 2016
0.023
-0.001
-2.9%
Ranking of countries by current statistics by years