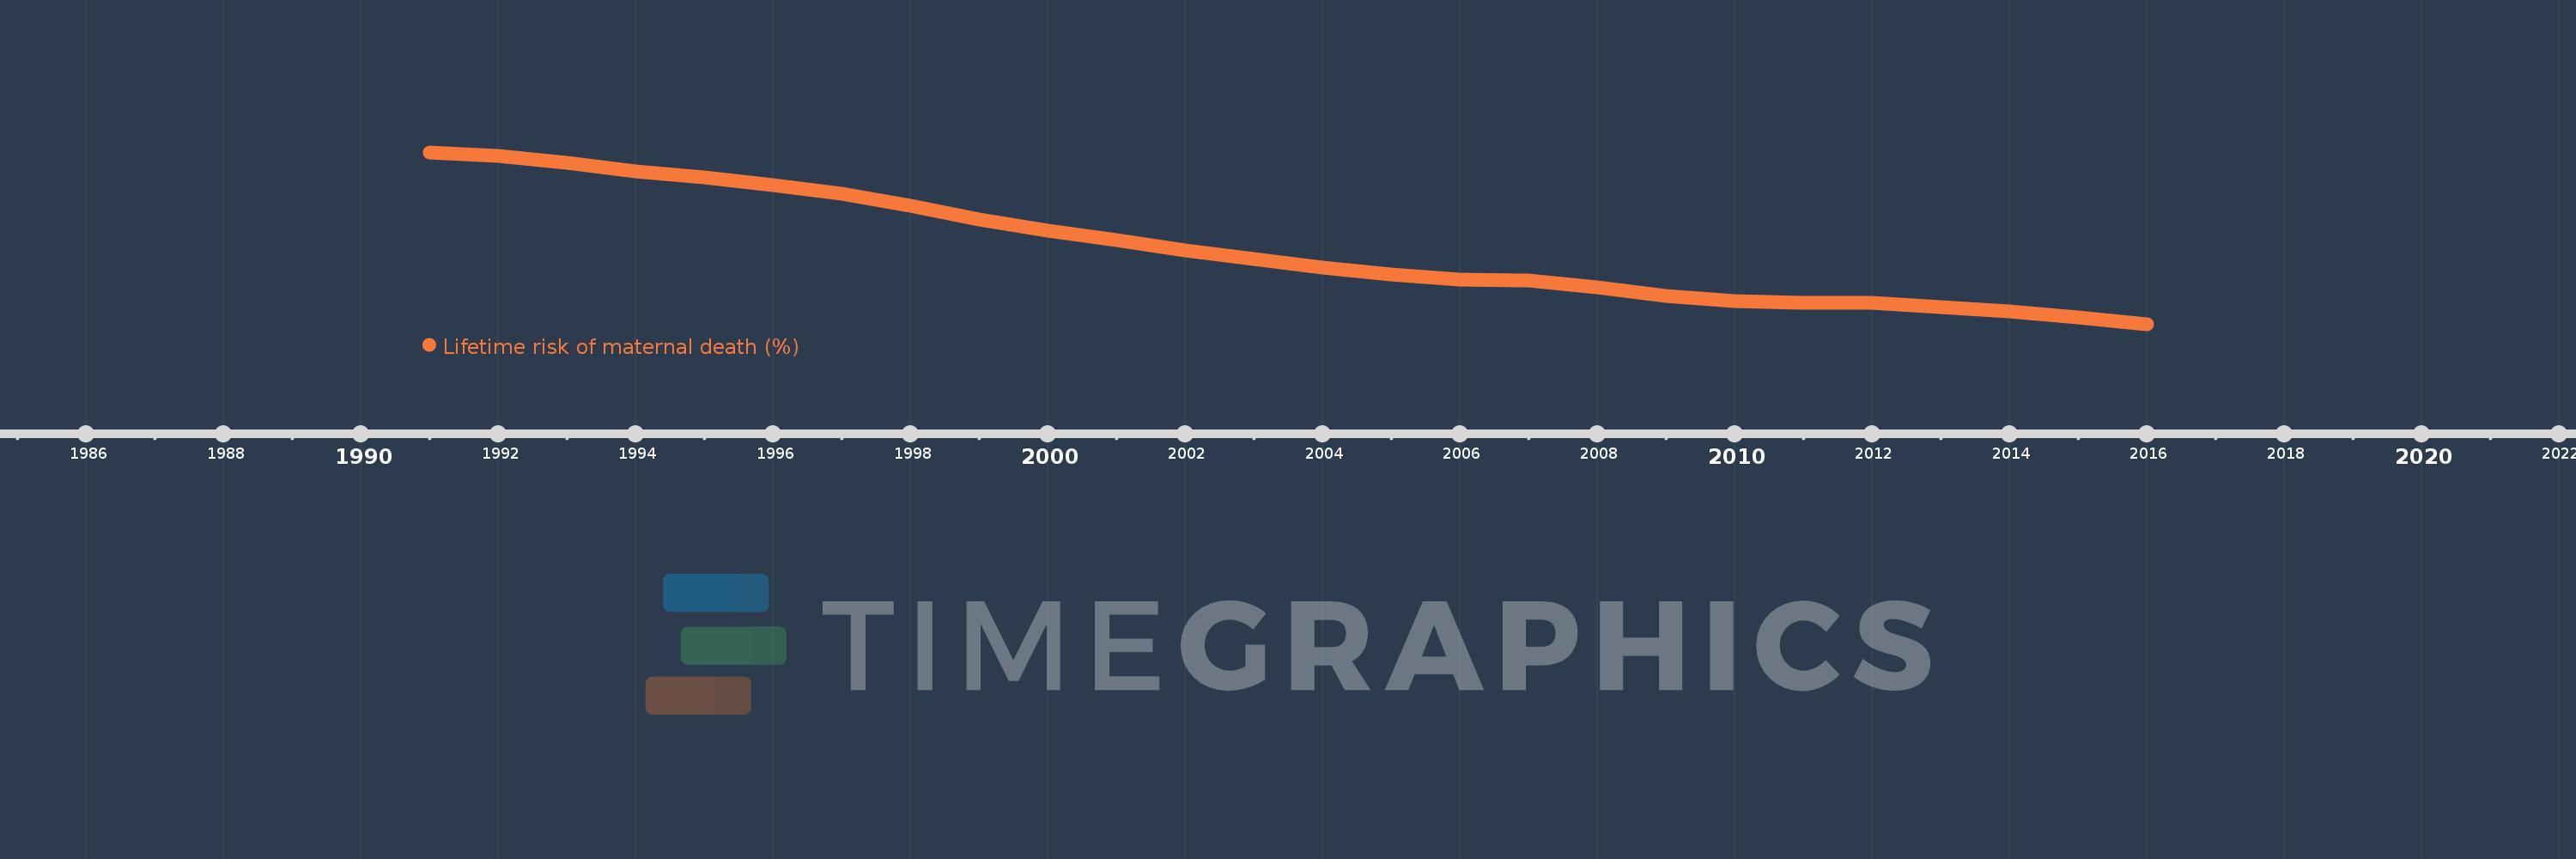
This timeline shows a graph from 1991 to 2016 of Togo. No data until 1990. Number of actual observations by date: 26.
Source name:
World Development Indicators
Source organization:
WHO, UNICEF, UNFPA, The World Bank, and the United Nations Population Division. Trends in Maternal Mortality: 1990 to 2015. Geneva, World Health Organization, 2015
Categories, topics:
Health, Gender
Last updated:
apr 23, 2017
Indicators value changes by year
Meaning:
2.513
Minimum:
1.718
jan 1, 2016
Maximum:
3.519
jan 1, 1991
At the date of observation
Value
Absolute change
Change from the previous value
jan 1, 1991
3.519
+3.519
0.0%
jan 1, 1992
3.485
-0.034
-0.98%
jan 1, 1993
3.409
-0.076
-2.17%
jan 1, 1994
3.318
-0.091
-2.66%
jan 1, 1995
3.255
-0.063
-1.91%
jan 1, 1996
3.176
-0.079
-2.43%
jan 1, 1997
3.084
-0.092
-2.88%
jan 1, 1998
2.958
-0.126
-4.08%
jan 1, 1999
2.818
-0.141
-4.76%
jan 1, 2000
2.703
-0.114
-4.06%
jan 1, 2001
2.599
-0.104
-3.85%
jan 1, 2002
2.496
-0.103
-3.97%
jan 1, 2003
2.397
-0.099
-3.95%
jan 1, 2004
2.314
-0.083
-3.47%
jan 1, 2005
2.241
-0.073
-3.16%
jan 1, 2006
2.184
-0.057
-2.55%
jan 1, 2007
2.177
-0.007
-0.32%
jan 1, 2008
2.103
-0.074
-3.42%
jan 1, 2009
2.014
-0.089
-4.22%
jan 1, 2010
1.96
-0.053
-2.65%
jan 1, 2011
1.939
-0.021
-1.08%
jan 1, 2012
1.94
+0.001
0.04%
jan 1, 2013
1.896
-0.044
-2.29%
jan 1, 2014
1.849
-0.046
-2.44%
jan 1, 2015
1.786
-0.063
-3.41%
jan 1, 2016
1.718
-0.069
-3.84%
Ranking of countries by current statistics by years