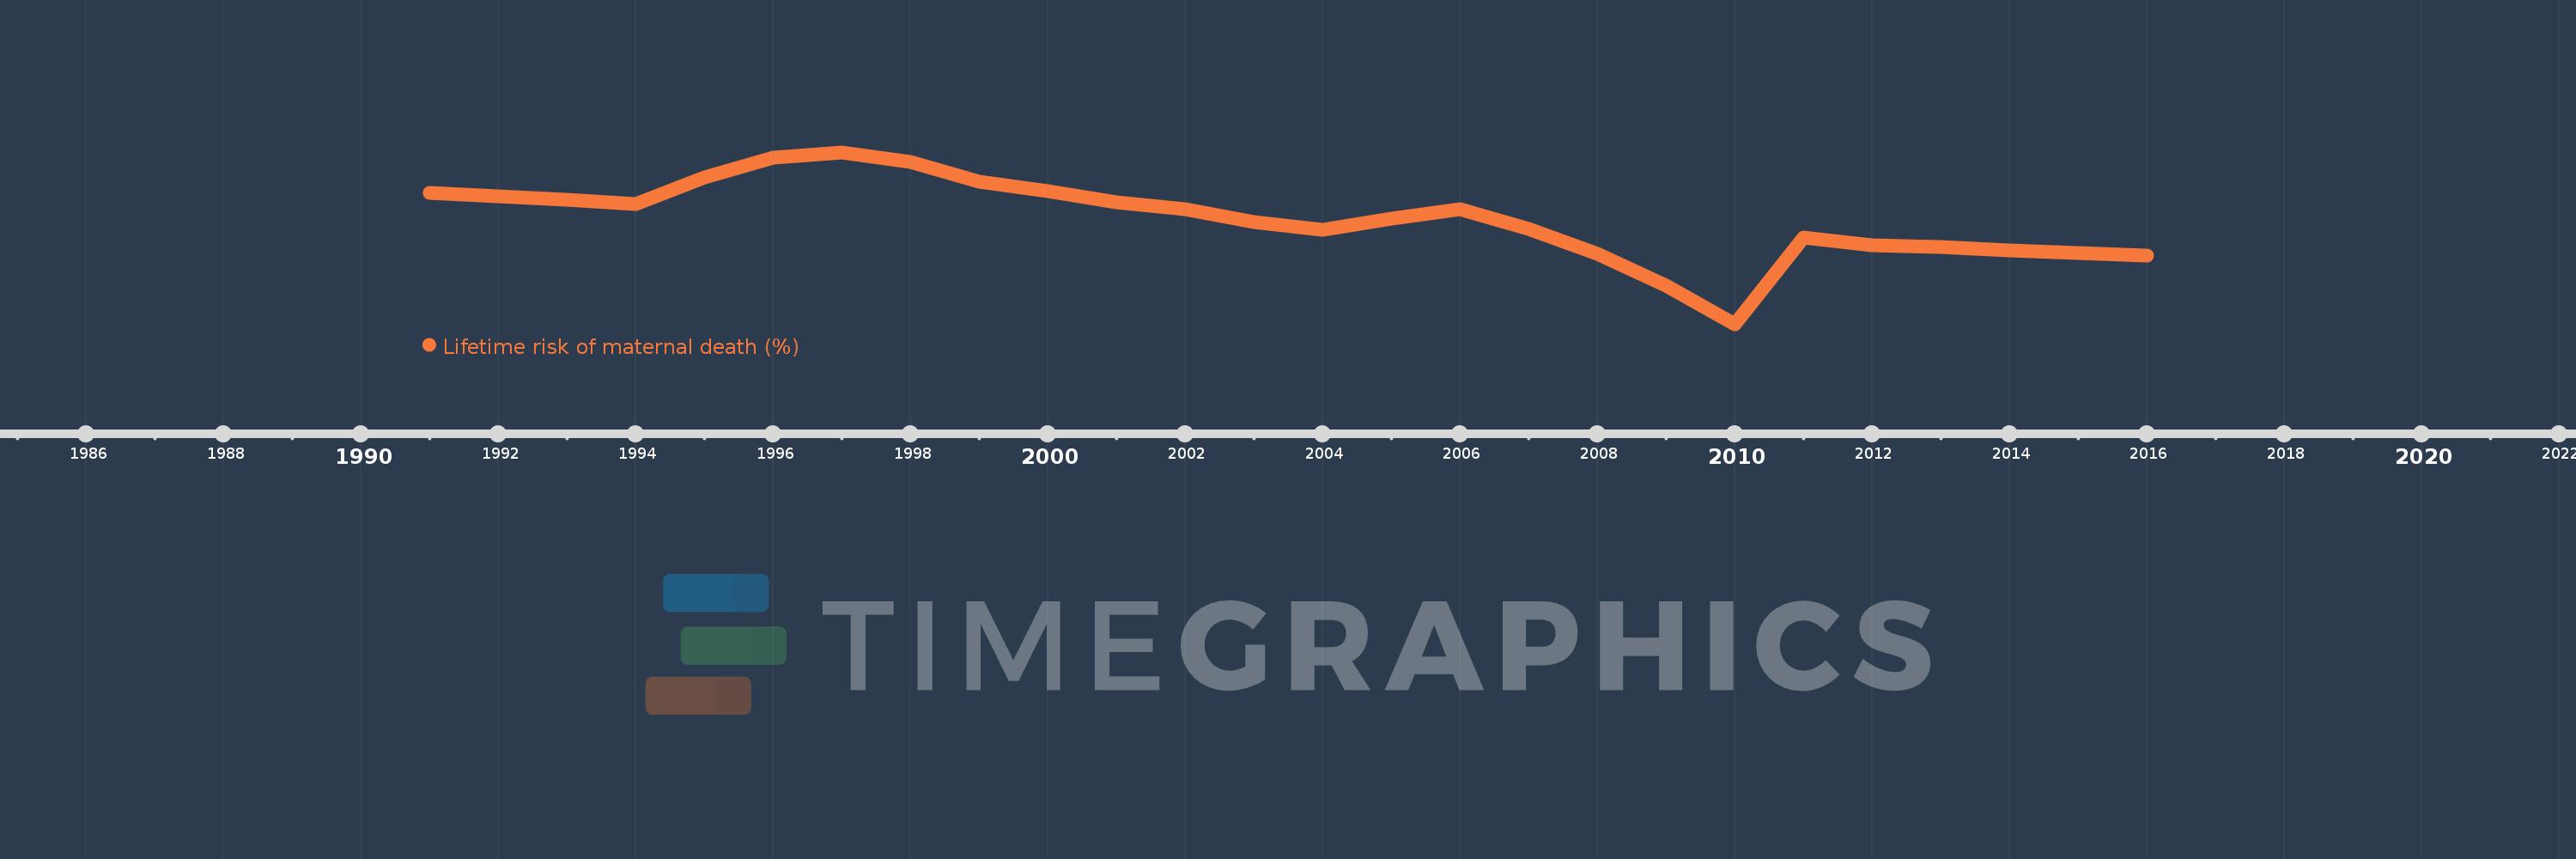
This timeline shows a graph from 1991 to 2016 of Guyana. No data until 1990. Number of actual observations by date: 26.
Source name:
World Development Indicators
Source organization:
WHO, UNICEF, UNFPA, The World Bank, and the United Nations Population Division. Trends in Maternal Mortality: 1990 to 2015. Geneva, World Health Organization, 2015
Categories, topics:
Health, Gender
Last updated:
apr 23, 2017
Indicators value changes by year
Meaning:
0.654
Minimum:
0.462
jan 1, 2010
Maximum:
0.774
jan 1, 1997
At the date of observation
Value
Absolute change
Change from the previous value
jan 1, 1991
0.701
+0.701
0.0%
jan 1, 1992
0.694
-0.007
-0.97%
jan 1, 1993
0.688
-0.006
-0.86%
jan 1, 1994
0.68
-0.008
-1.18%
jan 1, 1995
0.728
+0.049
7.15%
jan 1, 1996
0.764
+0.036
4.9%
jan 1, 1997
0.774
+0.01
1.3%
jan 1, 1998
0.757
-0.017
-2.16%
jan 1, 1999
0.721
-0.036
-4.74%
jan 1, 2000
0.703
-0.018
-2.53%
jan 1, 2001
0.684
-0.019
-2.67%
jan 1, 2002
0.671
-0.014
-2.0%
jan 1, 2003
0.647
-0.024
-3.51%
jan 1, 2004
0.633
-0.014
-2.23%
jan 1, 2005
0.654
+0.022
3.46%
jan 1, 2006
0.671
+0.017
2.6%
jan 1, 2007
0.635
-0.037
-5.45%
jan 1, 2008
0.59
-0.045
-7.07%
jan 1, 2009
0.532
-0.058
-9.9%
jan 1, 2010
0.462
-0.07
-13.09%
jan 1, 2011
0.62
+0.158
34.28%
jan 1, 2012
0.606
-0.014
-2.32%
jan 1, 2013
0.603
-0.003
-0.48%
jan 1, 2014
0.596
-0.007
-1.09%
jan 1, 2015
0.592
-0.004
-0.67%
jan 1, 2016
0.587
-0.006
-0.93%
Ranking of countries by current statistics by years