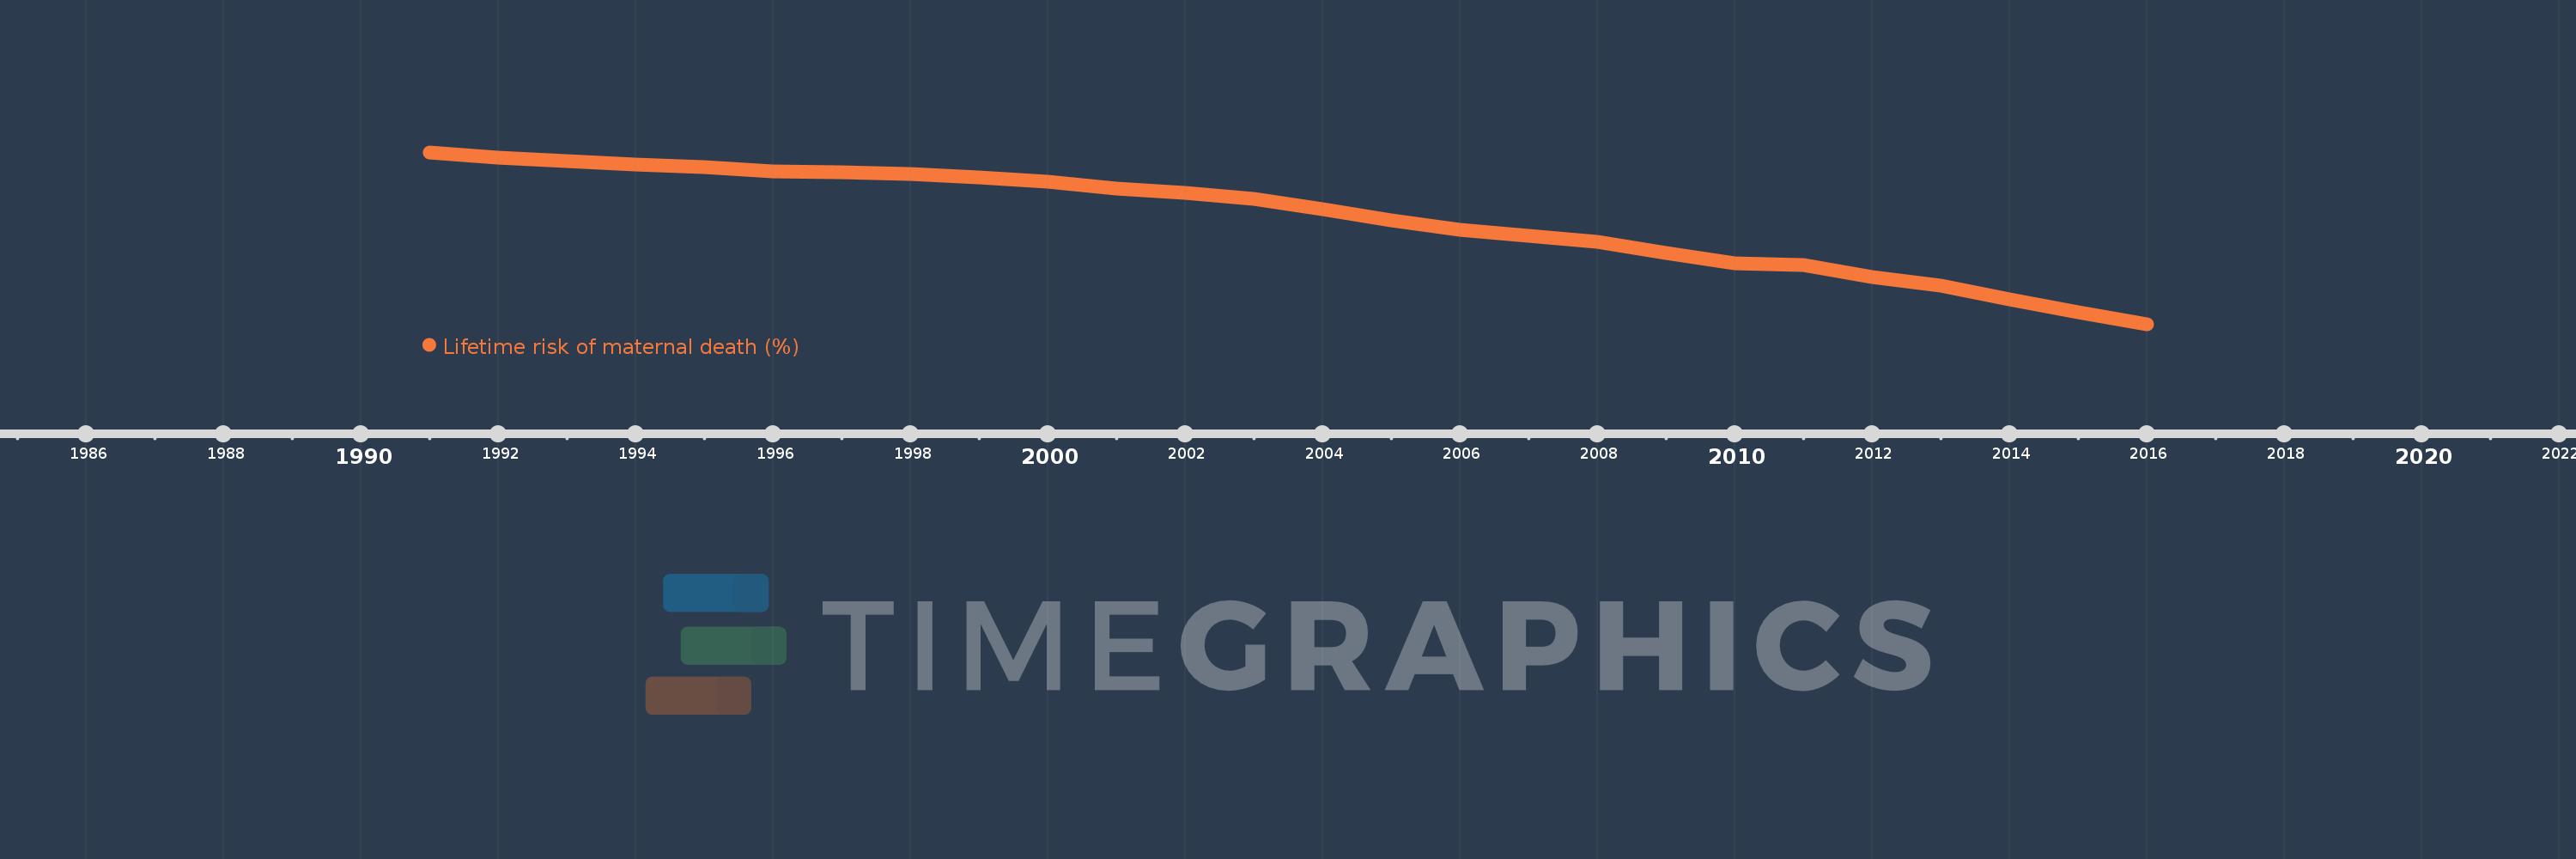
This timeline shows a graph from 1991 to 2016 of Niger. No data until 1990. Number of actual observations by date: 26.
Source name:
World Development Indicators
Source organization:
WHO, UNICEF, UNFPA, The World Bank, and the United Nations Population Division. Trends in Maternal Mortality: 1990 to 2015. Geneva, World Health Organization, 2015
Categories, topics:
Health, Gender
Last updated:
apr 23, 2017
Indicators value changes by year
Meaning:
5.858
Minimum:
4.37
jan 1, 2016
Maximum:
6.785
jan 1, 1991
At the date of observation
Value
Absolute change
Change from the previous value
jan 1, 1991
6.785
+6.785
0.0%
jan 1, 1992
6.716
-0.07
-1.03%
jan 1, 1993
6.662
-0.054
-0.8%
jan 1, 1994
6.609
-0.053
-0.8%
jan 1, 1995
6.582
-0.026
-0.4%
jan 1, 1996
6.514
-0.068
-1.03%
jan 1, 1997
6.509
-0.005
-0.08%
jan 1, 1998
6.482
-0.027
-0.41%
jan 1, 1999
6.428
-0.054
-0.84%
jan 1, 2000
6.371
-0.057
-0.88%
jan 1, 2001
6.271
-0.1
-1.57%
jan 1, 2002
6.222
-0.05
-0.79%
jan 1, 2003
6.127
-0.094
-1.52%
jan 1, 2004
5.987
-0.14
-2.28%
jan 1, 2005
5.829
-0.158
-2.64%
jan 1, 2006
5.696
-0.133
-2.28%
jan 1, 2007
5.611
-0.085
-1.49%
jan 1, 2008
5.524
-0.087
-1.55%
jan 1, 2009
5.37
-0.154
-2.79%
jan 1, 2010
5.23
-0.14
-2.6%
jan 1, 2011
5.201
-0.029
-0.56%
jan 1, 2012
5.036
-0.165
-3.18%
jan 1, 2013
4.912
-0.124
-2.45%
jan 1, 2014
4.725
-0.187
-3.81%
jan 1, 2015
4.542
-0.183
-3.88%
jan 1, 2016
4.37
-0.172
-3.78%
Ranking of countries by current statistics by years