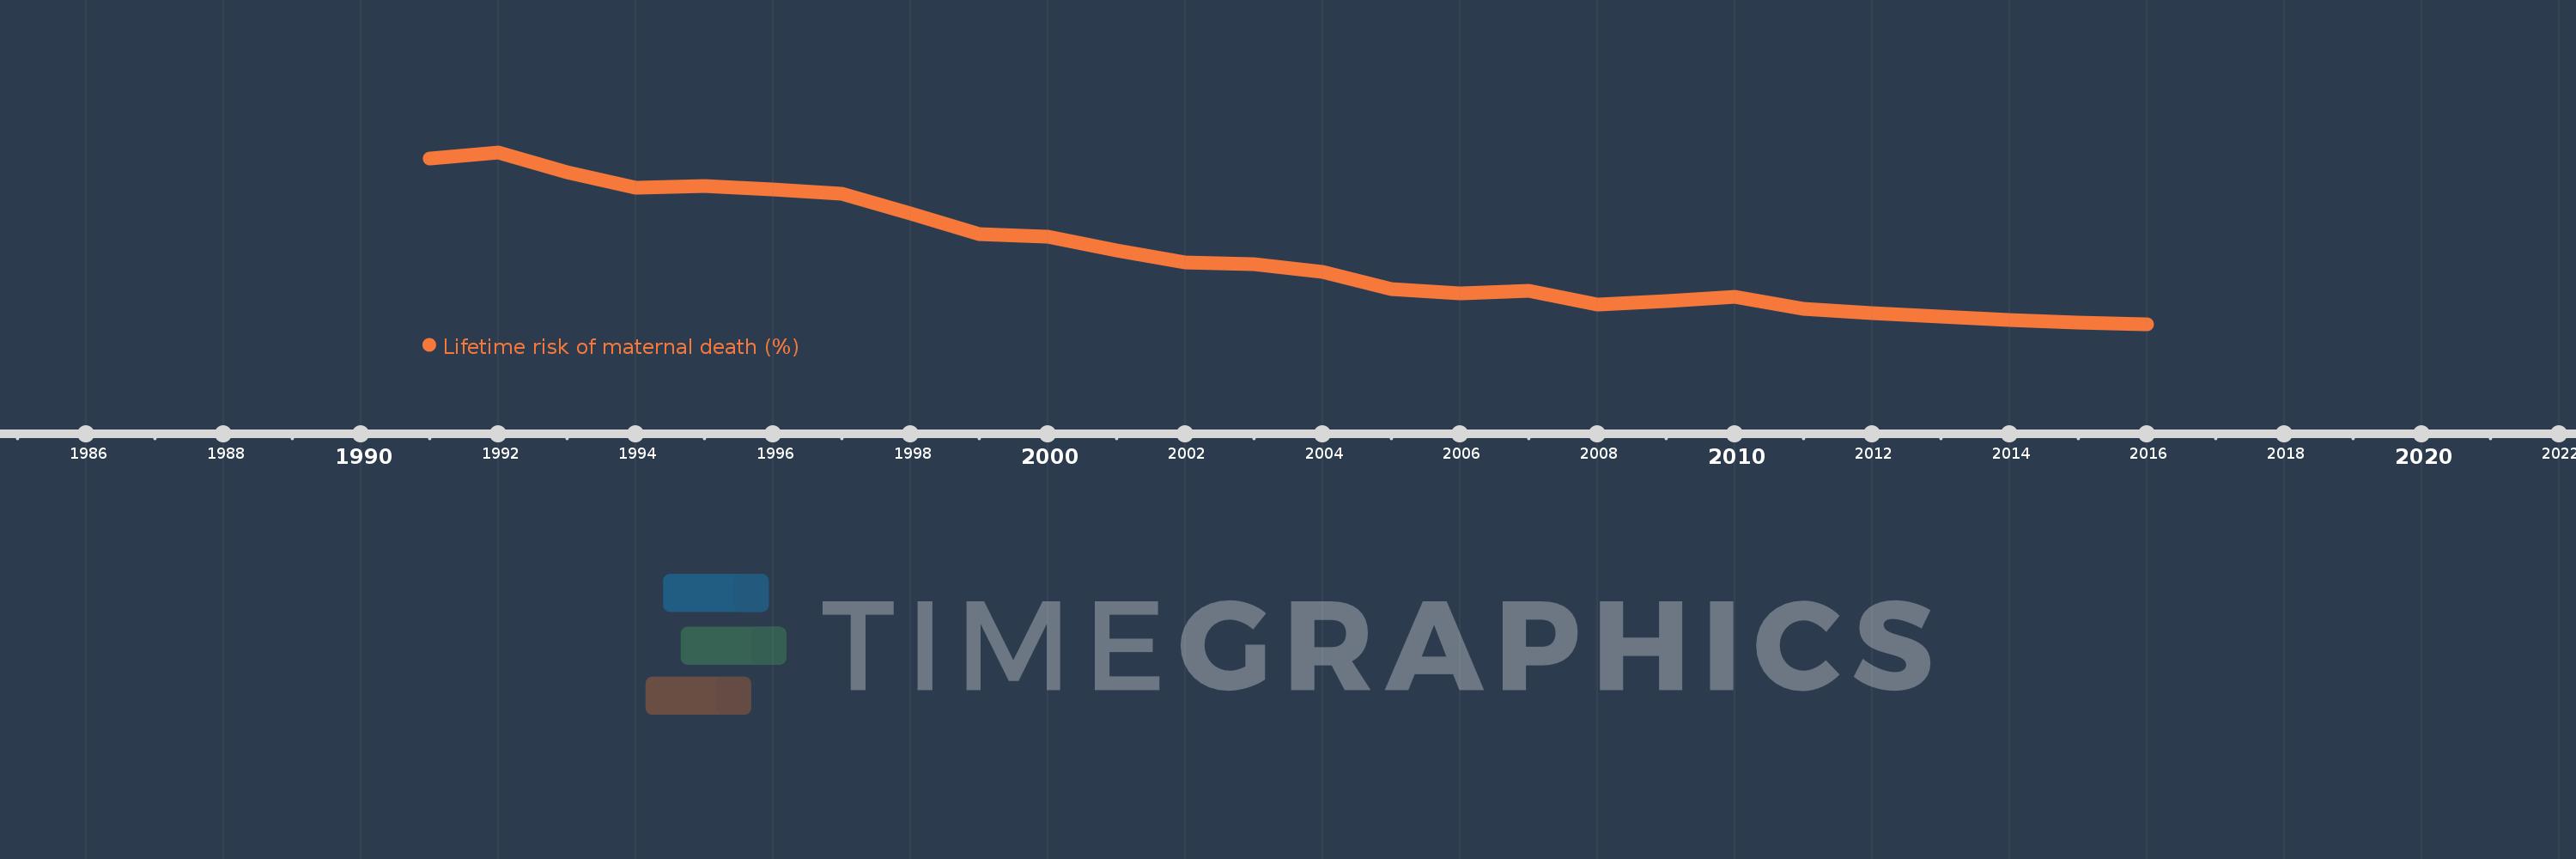
This timeline shows a graph from 1991 to 2016 of Costa Rica. No data until 1990. Number of actual observations by date: 26.
Source name:
World Development Indicators
Source organization:
WHO, UNICEF, UNFPA, The World Bank, and the United Nations Population Division. Trends in Maternal Mortality: 1990 to 2015. Geneva, World Health Organization, 2015
Categories, topics:
Health, Gender
Last updated:
apr 23, 2017
Indicators value changes by year
Meaning:
0.093
Minimum:
0.048
jan 1, 2016
Maximum:
0.16
jan 1, 1992
At the date of observation
Value
Absolute change
Change from the previous value
jan 1, 1991
0.156
+0.156
0.0%
jan 1, 1992
0.16
+0.004
2.54%
jan 1, 1993
0.147
-0.013
-8.12%
jan 1, 1994
0.137
-0.01
-7.02%
jan 1, 1995
0.138
+0.001
0.86%
jan 1, 1996
0.136
-0.002
-1.64%
jan 1, 1997
0.133
-0.003
-2.37%
jan 1, 1998
0.12
-0.012
-9.33%
jan 1, 1999
0.107
-0.014
-11.33%
jan 1, 2000
0.105
-0.002
-1.76%
jan 1, 2001
0.096
-0.009
-8.16%
jan 1, 2002
0.088
-0.008
-8.35%
jan 1, 2003
0.087
-0.001
-1.39%
jan 1, 2004
0.082
-0.005
-6.16%
jan 1, 2005
0.071
-0.01
-12.47%
jan 1, 2006
0.068
-0.003
-4.44%
jan 1, 2007
0.07
+0.002
2.82%
jan 1, 2008
0.061
-0.009
-12.45%
jan 1, 2009
0.063
+0.001
1.75%
jan 1, 2010
0.066
+0.003
4.76%
jan 1, 2011
0.058
-0.007
-10.89%
jan 1, 2012
0.055
-0.003
-5.82%
jan 1, 2013
0.053
-0.002
-3.9%
jan 1, 2014
0.051
-0.002
-3.84%
jan 1, 2015
0.049
-0.002
-3.4%
jan 1, 2016
0.048
-0.001
-2.93%
Ranking of countries by current statistics by years