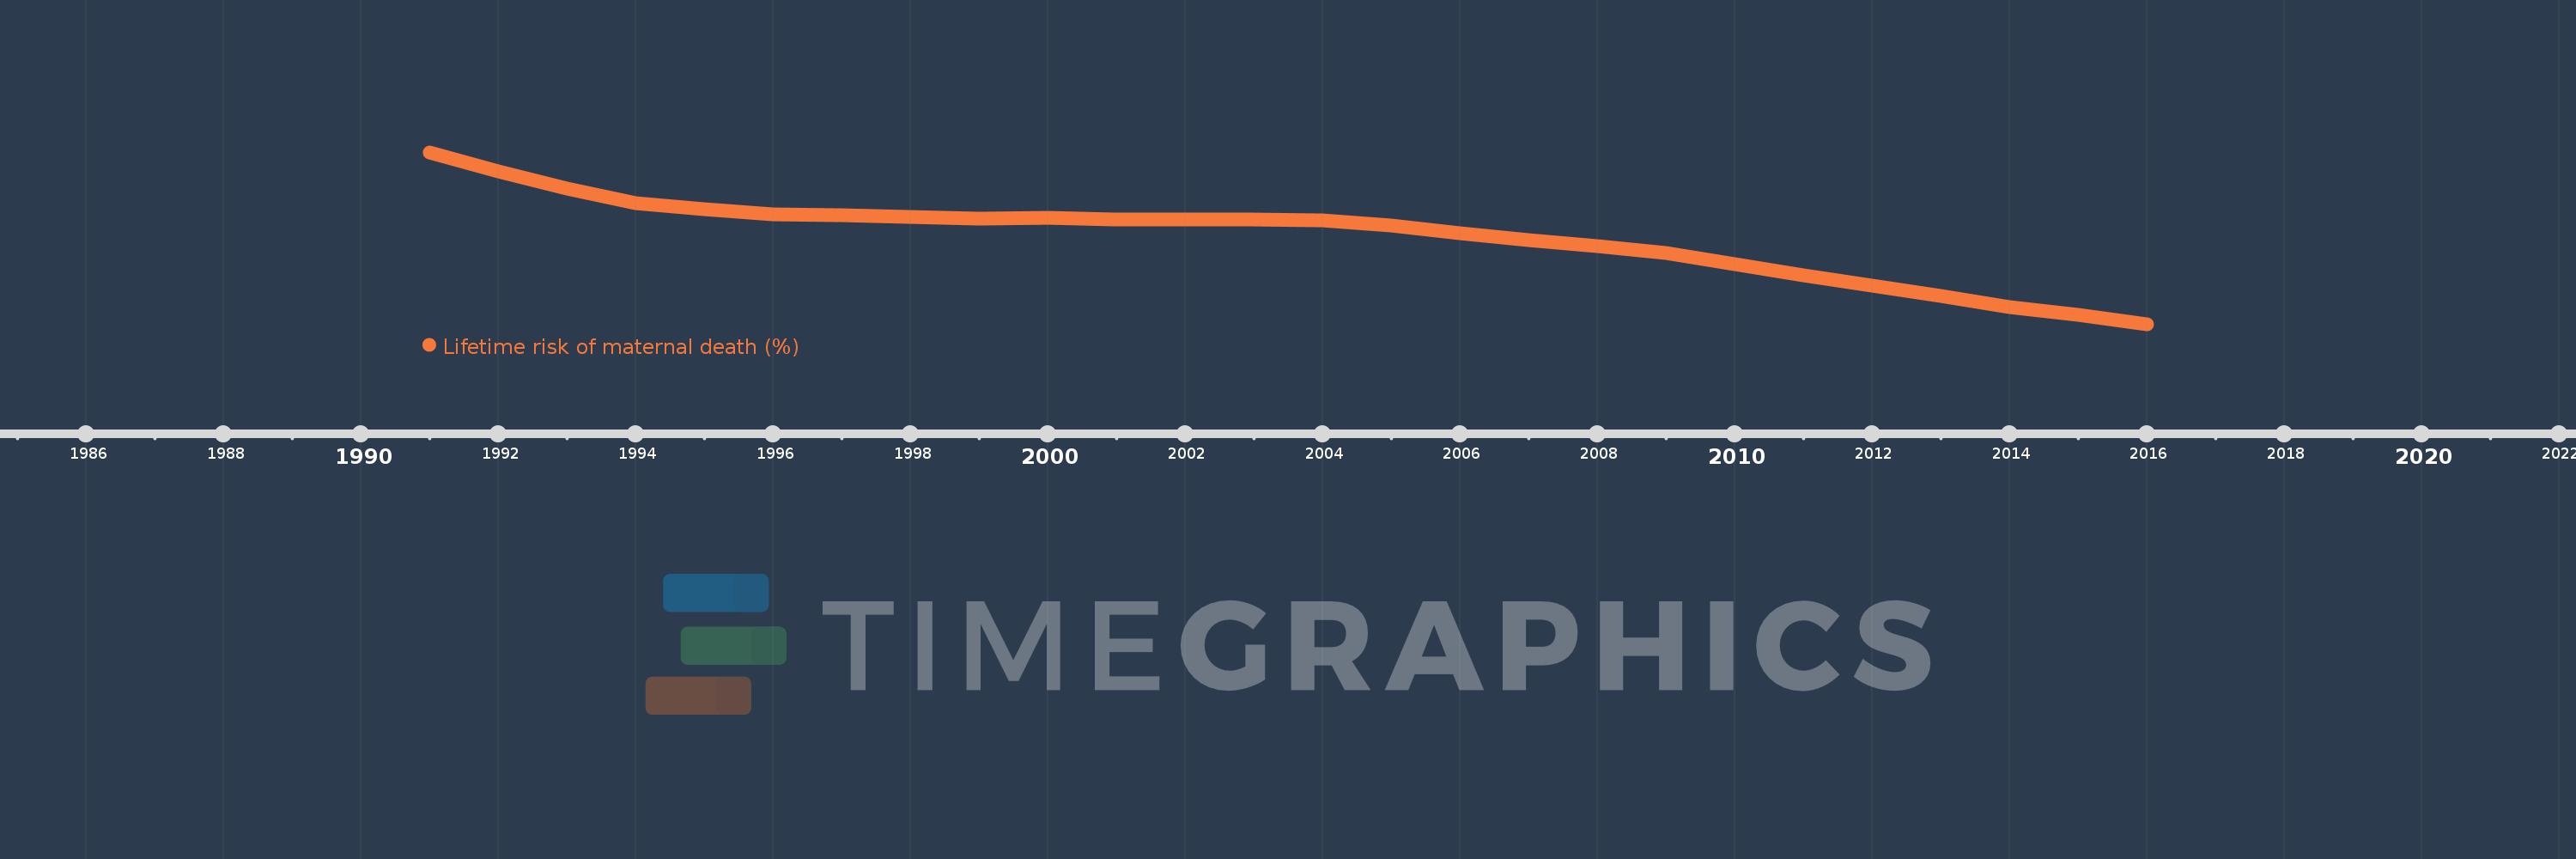
This timeline shows a graph from 1991 to 2016 of Kenya. No data until 1990. Number of actual observations by date: 26.
Source name:
World Development Indicators
Source organization:
WHO, UNICEF, UNFPA, The World Bank, and the United Nations Population Division. Trends in Maternal Mortality: 1990 to 2015. Geneva, World Health Organization, 2015
Categories, topics:
Health, Gender
Last updated:
apr 23, 2017
Indicators value changes by year
Meaning:
3.39
Minimum:
2.353
jan 1, 2016
Maximum:
4.386
jan 1, 1991
At the date of observation
Value
Absolute change
Change from the previous value
jan 1, 1991
4.386
+4.386
0.0%
jan 1, 1992
4.164
-0.222
-5.07%
jan 1, 1993
3.955
-0.209
-5.02%
jan 1, 1994
3.782
-0.173
-4.38%
jan 1, 1995
3.71
-0.071
-1.89%
jan 1, 1996
3.651
-0.059
-1.59%
jan 1, 1997
3.641
-0.011
-0.3%
jan 1, 1998
3.619
-0.021
-0.59%
jan 1, 1999
3.607
-0.012
-0.33%
jan 1, 2000
3.613
+0.006
0.17%
jan 1, 2001
3.588
-0.026
-0.71%
jan 1, 2002
3.595
+0.007
0.21%
jan 1, 2003
3.591
-0.004
-0.11%
jan 1, 2004
3.587
-0.004
-0.11%
jan 1, 2005
3.516
-0.072
-2.0%
jan 1, 2006
3.432
-0.083
-2.37%
jan 1, 2007
3.344
-0.088
-2.56%
jan 1, 2008
3.278
-0.067
-1.99%
jan 1, 2009
3.194
-0.084
-2.55%
jan 1, 2010
3.068
-0.126
-3.94%
jan 1, 2011
2.936
-0.132
-4.29%
jan 1, 2012
2.814
-0.122
-4.16%
jan 1, 2013
2.689
-0.126
-4.46%
jan 1, 2014
2.554
-0.134
-5.0%
jan 1, 2015
2.46
-0.094
-3.67%
jan 1, 2016
2.353
-0.107
-4.36%
Ranking of countries by current statistics by years