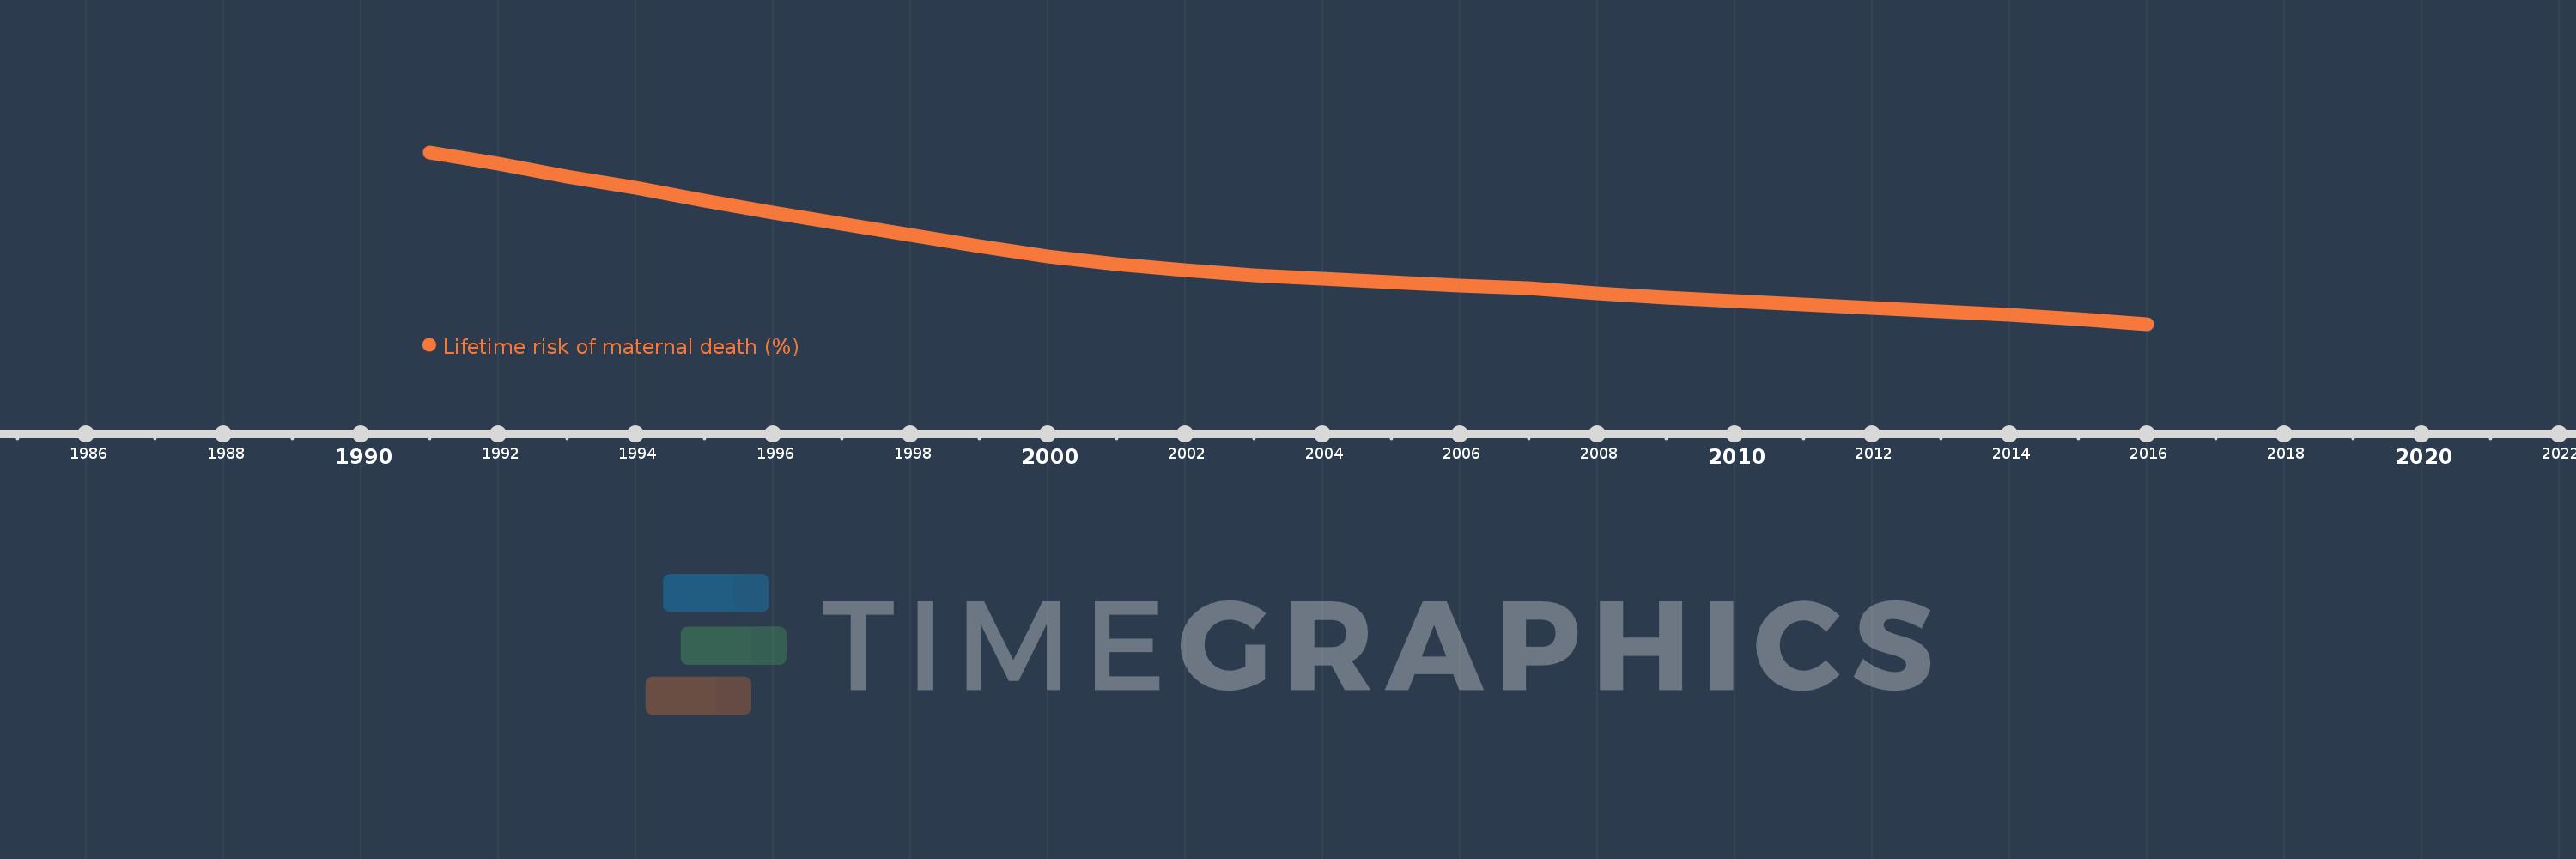
This timeline shows a graph from 1991 to 2016 of Yemen, Rep.. No data until 1990. Number of actual observations by date: 26.
Source name:
World Development Indicators
Source organization:
WHO, UNICEF, UNFPA, The World Bank, and the United Nations Population Division. Trends in Maternal Mortality: 1990 to 2015. Geneva, World Health Organization, 2015
Categories, topics:
Health, Gender
Last updated:
apr 23, 2017
Indicators value changes by year
Meaning:
2.772
Minimum:
1.659
jan 1, 2016
Maximum:
4.662
jan 1, 1991
At the date of observation
Value
Absolute change
Change from the previous value
jan 1, 1991
4.662
+4.662
0.0%
jan 1, 1992
4.467
-0.195
-4.18%
jan 1, 1993
4.246
-0.221
-4.94%
jan 1, 1994
4.052
-0.194
-4.56%
jan 1, 1995
3.823
-0.23
-5.66%
jan 1, 1996
3.602
-0.221
-5.77%
jan 1, 1997
3.414
-0.188
-5.23%
jan 1, 1998
3.216
-0.198
-5.79%
jan 1, 1999
3.017
-0.2
-6.21%
jan 1, 2000
2.848
-0.168
-5.58%
jan 1, 2001
2.702
-0.146
-5.14%
jan 1, 2002
2.598
-0.104
-3.85%
jan 1, 2003
2.514
-0.084
-3.22%
jan 1, 2004
2.452
-0.062
-2.48%
jan 1, 2005
2.394
-0.058
-2.36%
jan 1, 2006
2.335
-0.059
-2.45%
jan 1, 2007
2.281
-0.055
-2.34%
jan 1, 2008
2.205
-0.076
-3.32%
jan 1, 2009
2.116
-0.089
-4.05%
jan 1, 2010
2.06
-0.055
-2.6%
jan 1, 2011
2.004
-0.056
-2.74%
jan 1, 2012
1.945
-0.059
-2.97%
jan 1, 2013
1.887
-0.057
-2.95%
jan 1, 2014
1.829
-0.058
-3.06%
jan 1, 2015
1.752
-0.077
-4.21%
jan 1, 2016
1.659
-0.094
-5.34%
Ranking of countries by current statistics by years