29
/
en
AIzaSyAYiBZKx7MnpbEhh9jyipgxe19OcubqV5w
April 1, 2024
67009
American Samoa
ASM
true
2
1
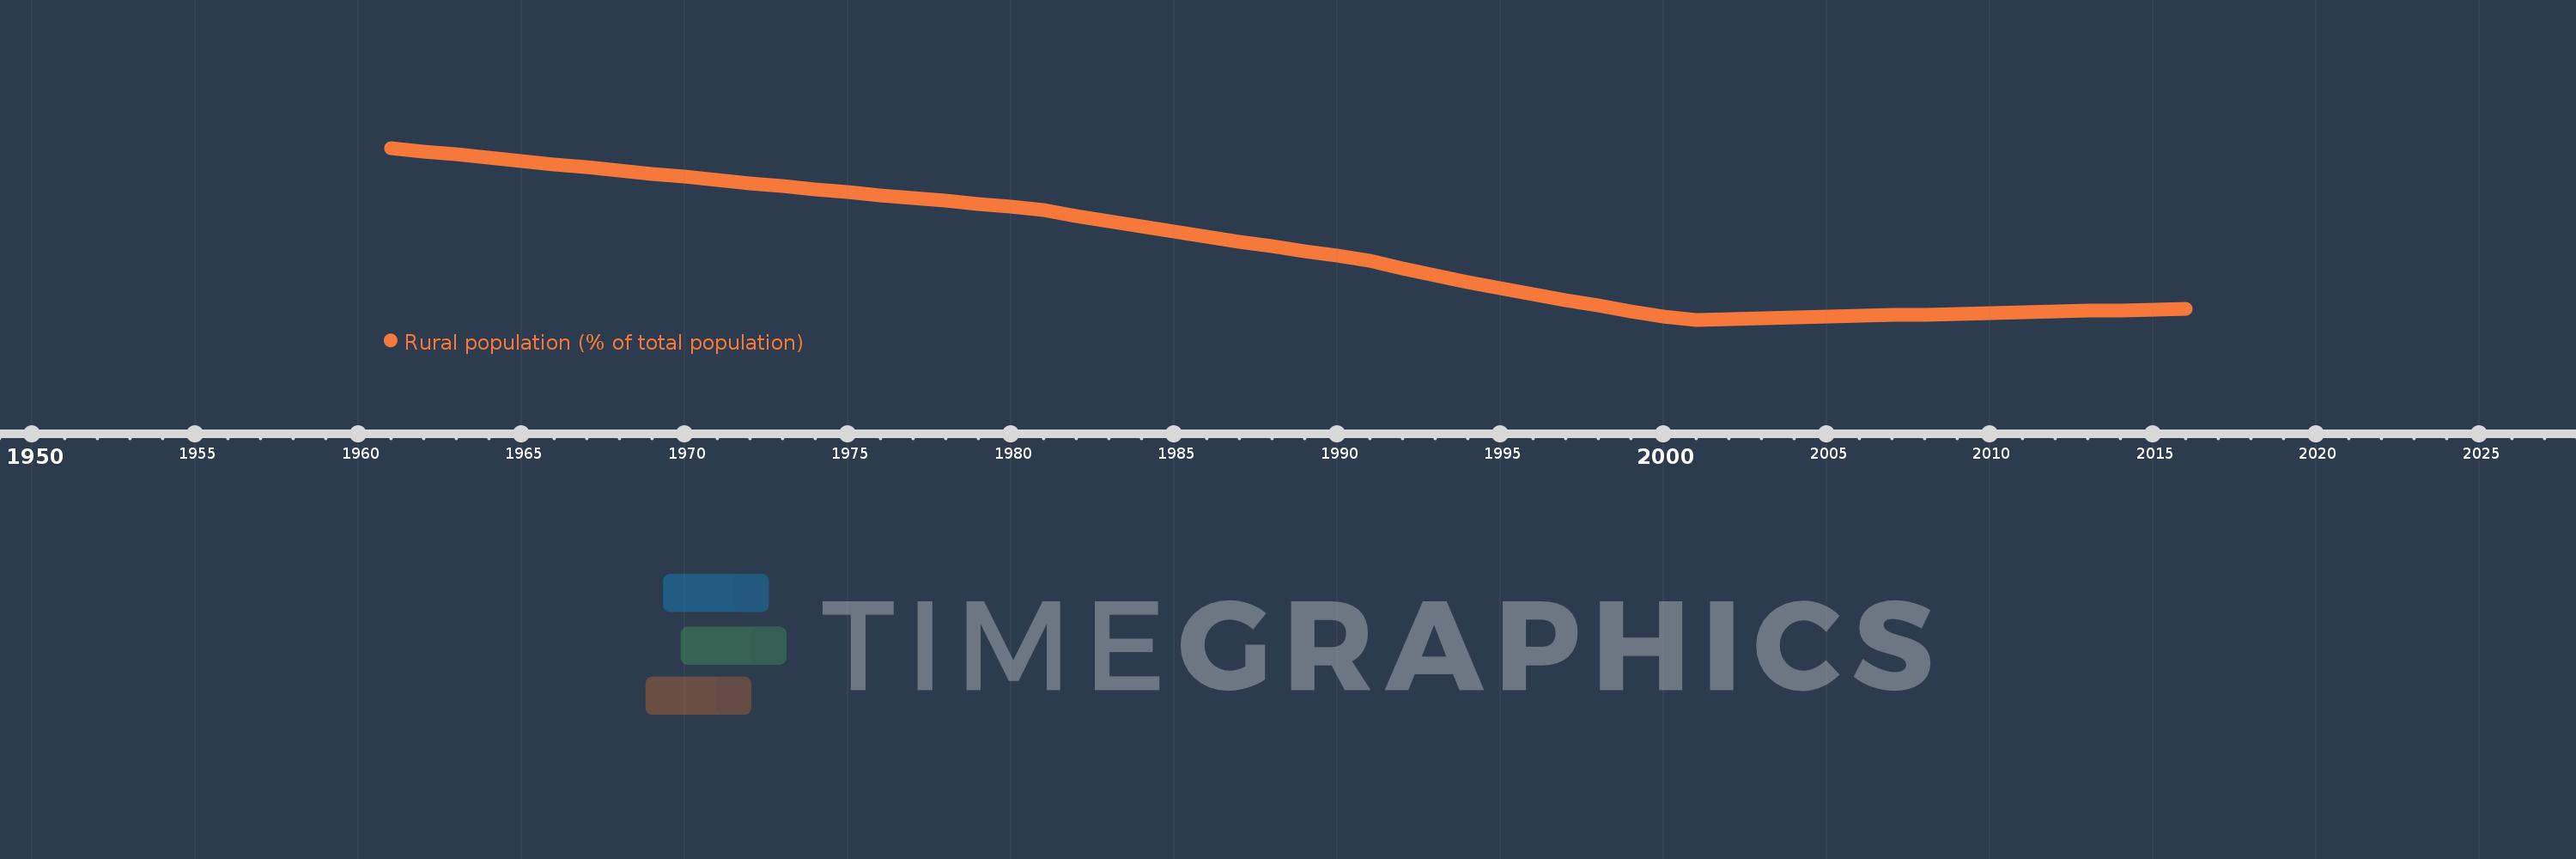
Rural population (% of total population)
2016,2015,2014,2013,2012,2011,2010,2009,2008,2007,2006,2005,2004,2003,2002,2001,2000,1999,1998,1997,1996,1995,1994,1993,1992,1991,1990,1989,1988,1987,1986,1985,1984,1983,1982,1981,1980,1979,1978,1977,1976,1975,1974,1973,1972,1971,1970,1969,1968,1967,1966,1965,1964,1963,1962,1961
This statistics in other country:
AfghanistanAlbaniaAlgeriaAmerican SamoaAndorraAngolaAntigua and BarbudaArab WorldArgentinaArmeniaArubaAustraliaAustriaAzerbaijanBahamas, TheBahrainBangladeshBarbadosBelarusBelgiumBelizeBeninBermudaBhutanBoliviaBosnia and HerzegovinaBotswanaBrazilBritish Virgin IslandsBrunei DarussalamBulgariaBurkina FasoBurundiCabo VerdeCambodiaCameroonCanadaCaribbean small statesCayman IslandsCentral African RepublicCentral Europe and the BalticsChadChannel IslandsChileChinaColombiaComorosCongo, Dem. Rep.Congo, Rep.Costa RicaCote d'IvoireCroatiaCubaCuracaoCyprusCzech RepublicDenmarkDjiboutiDominicaDominican RepublicEarly-demographic dividendEast Asia & PacificEast Asia & Pacific (excluding high income)East Asia & Pacific (IDA & IBRD countries)EcuadorEgypt, Arab Rep.El SalvadorEquatorial GuineaEritreaEstoniaEthiopiaEuro areaEurope & Central AsiaEurope & Central Asia (excluding high income)Europe & Central Asia (IDA & IBRD countries)European UnionFaroe IslandsFijiFinlandFragile and conflict affected situationsFranceFrench PolynesiaGabonGambia, TheGeorgiaGermanyGhanaGibraltarGreeceGreenlandGrenadaGuamGuatemalaGuineaGuinea-BissauGuyanaHaitiHeavily indebted poor countries (HIPC)High incomeHondurasHong Kong SAR, ChinaHungaryIBRD onlyIcelandIDA & IBRD totalIDA blendIDA onlyIDA totalIndiaIndonesiaIran, Islamic Rep.IraqIrelandIsle of ManIsraelItalyJamaicaJapanJordanKazakhstanKenyaKiribatiKorea, Dem. People’s Rep.Korea, Rep.KuwaitKyrgyz RepublicLao PDRLate-demographic dividendLatin America & Caribbean Latin America & Caribbean (excluding high income)Latin America & the Caribbean (IDA & IBRD countries)LatviaLeast developed countries: UN classificationLebanonLesothoLiberiaLibyaLiechtensteinLithuaniaLow & middle incomeLow incomeLower middle incomeLuxembourgMacao SAR, ChinaMacedonia, FYRMadagascarMalawiMalaysiaMaldivesMaliMaltaMarshall IslandsMauritaniaMauritiusMexicoMicronesia, Fed. Sts.Middle East & North AfricaMiddle East & North Africa (excluding high income)Middle East & North Africa (IDA & IBRD countries)Middle incomeMoldovaMonacoMongoliaMontenegroMoroccoMozambiqueMyanmarNamibiaNauruNepalNetherlandsNew CaledoniaNew ZealandNicaraguaNigerNigeriaNorth AmericaNorthern Mariana IslandsNorwayOECD membersOmanOther small statesPacific island small statesPakistanPalauPanamaPapua New GuineaParaguayPeruPhilippinesPolandPortugalPost-demographic dividendPre-demographic dividendPuerto RicoQatarRomaniaRussian FederationRwandaSamoaSan MarinoSao Tome and PrincipeSaudi ArabiaSenegalSerbiaSeychellesSierra LeoneSingaporeSint Maarten (Dutch part)Slovak RepublicSloveniaSmall statesSolomon IslandsSomaliaSouth AfricaSouth AsiaSouth Asia (IDA & IBRD)South SudanSpainSri LankaSt. Kitts and NevisSt. LuciaSt. Vincent and the GrenadinesSub-Saharan Africa Sub-Saharan Africa (excluding high income)Sub-Saharan Africa (IDA & IBRD countries)SudanSurinameSwazilandSwedenSwitzerlandSyrian Arab RepublicTajikistanTanzaniaThailandTimor-LesteTogoTongaTrinidad and TobagoTunisiaTurkeyTurkmenistanTurks and Caicos IslandsTuvaluUgandaUkraineUnited Arab EmiratesUnited KingdomUnited StatesUpper middle incomeUruguayUzbekistanVanuatuVenezuela, RBVietnamVirgin Islands (U.S.)West Bank and GazaWorldYemen, Rep.ZambiaZimbabwe Timeline:
This timeline shows a graph from 1961 to 2016 of American Samoa. No data until 1960. Number of actual observations by date: 56.
Source name:
World Development Indicators
Source organization:
World Bank Staff estimates based on United Nations, World Urbanization Prospects.
Categories, topics:
Agriculture & Rural Development
Last updated:
apr 23, 2017
Indicators value changes by year
Minimum:
11.413
jan 1, 2001
Maximum:
33.789
jan 1, 1961
At the date of observation
Value
Absolute change
Change from previous value
jan 1, 1961
33.789
+33.789
0.0%
jan 1, 1962
33.359
-0.43
-1.27%
jan 1, 1963
32.932
-0.427
-1.28%
jan 1, 1964
32.507
-0.425
-1.29%
jan 1, 1965
32.084
-0.423
-1.3%
jan 1, 1966
31.666
-0.418
-1.3%
jan 1, 1967
31.25
-0.416
-1.31%
jan 1, 1968
30.837
-0.413
-1.32%
jan 1, 1969
30.426
-0.411
-1.33%
jan 1, 1970
30.02
-0.406
-1.33%
jan 1, 1971
29.616
-0.404
-1.35%
jan 1, 1972
29.216
-0.4
-1.35%
jan 1, 1973
28.818
-0.398
-1.36%
jan 1, 1974
28.424
-0.394
-1.37%
jan 1, 1975
28.033
-0.391
-1.38%
jan 1, 1976
27.646
-0.387
-1.38%
jan 1, 1977
27.261
-0.385
-1.39%
jan 1, 1978
26.88
-0.381
-1.4%
jan 1, 1979
26.503
-0.377
-1.4%
jan 1, 1980
26.129
-0.374
-1.41%
jan 1, 1981
25.67
-0.459
-1.76%
jan 1, 1982
24.957
-0.713
-2.78%
jan 1, 1983
24.257
-0.7
-2.8%
jan 1, 1984
23.571
-0.686
-2.83%
jan 1, 1985
22.897
-0.674
-2.86%
jan 1, 1986
22.238
-0.659
-2.88%
jan 1, 1987
21.592
-0.646
-2.9%
jan 1, 1988
20.96
-0.632
-2.93%
jan 1, 1989
20.341
-0.619
-2.95%
jan 1, 1990
19.737
-0.604
-2.97%
jan 1, 1991
19.052
-0.685
-3.47%
jan 1, 1992
18.114
-0.938
-4.92%
jan 1, 1993
17.211
-0.903
-4.99%
jan 1, 1994
16.346
-0.865
-5.03%
jan 1, 1995
15.515
-0.831
-5.08%
jan 1, 1996
14.72
-0.795
-5.12%
jan 1, 1997
13.957
-0.763
-5.18%
jan 1, 1998
13.229
-0.728
-5.22%
jan 1, 1999
12.533
-0.696
-5.26%
jan 1, 2000
11.869
-0.664
-5.3%
jan 1, 2001
11.413
-0.456
-3.84%
jan 1, 2002
11.509
+0.096
0.84%
jan 1, 2003
11.606
+0.097
0.84%
jan 1, 2004
11.703
+0.097
0.84%
jan 1, 2005
11.802
+0.099
0.85%
jan 1, 2006
11.9
+0.098
0.83%
jan 1, 2007
12.0
+0.1
0.84%
jan 1, 2008
12.1
+0.1
0.83%
jan 1, 2009
12.201
+0.101
0.83%
jan 1, 2010
12.303
+0.102
0.84%
jan 1, 2011
12.406
+0.103
0.84%
jan 1, 2012
12.5
+0.094
0.76%
jan 1, 2013
12.587
+0.087
0.7%
jan 1, 2014
12.666
+0.079
0.63%
jan 1, 2015
12.736
+0.07
0.55%
jan 1, 2016
12.798
+0.062
0.49%
Ranking of countries by current statistics by years


Comments: