29
/
en
AIzaSyAYiBZKx7MnpbEhh9jyipgxe19OcubqV5w
April 1, 2024
105424
Chile
CHL
true
2
1
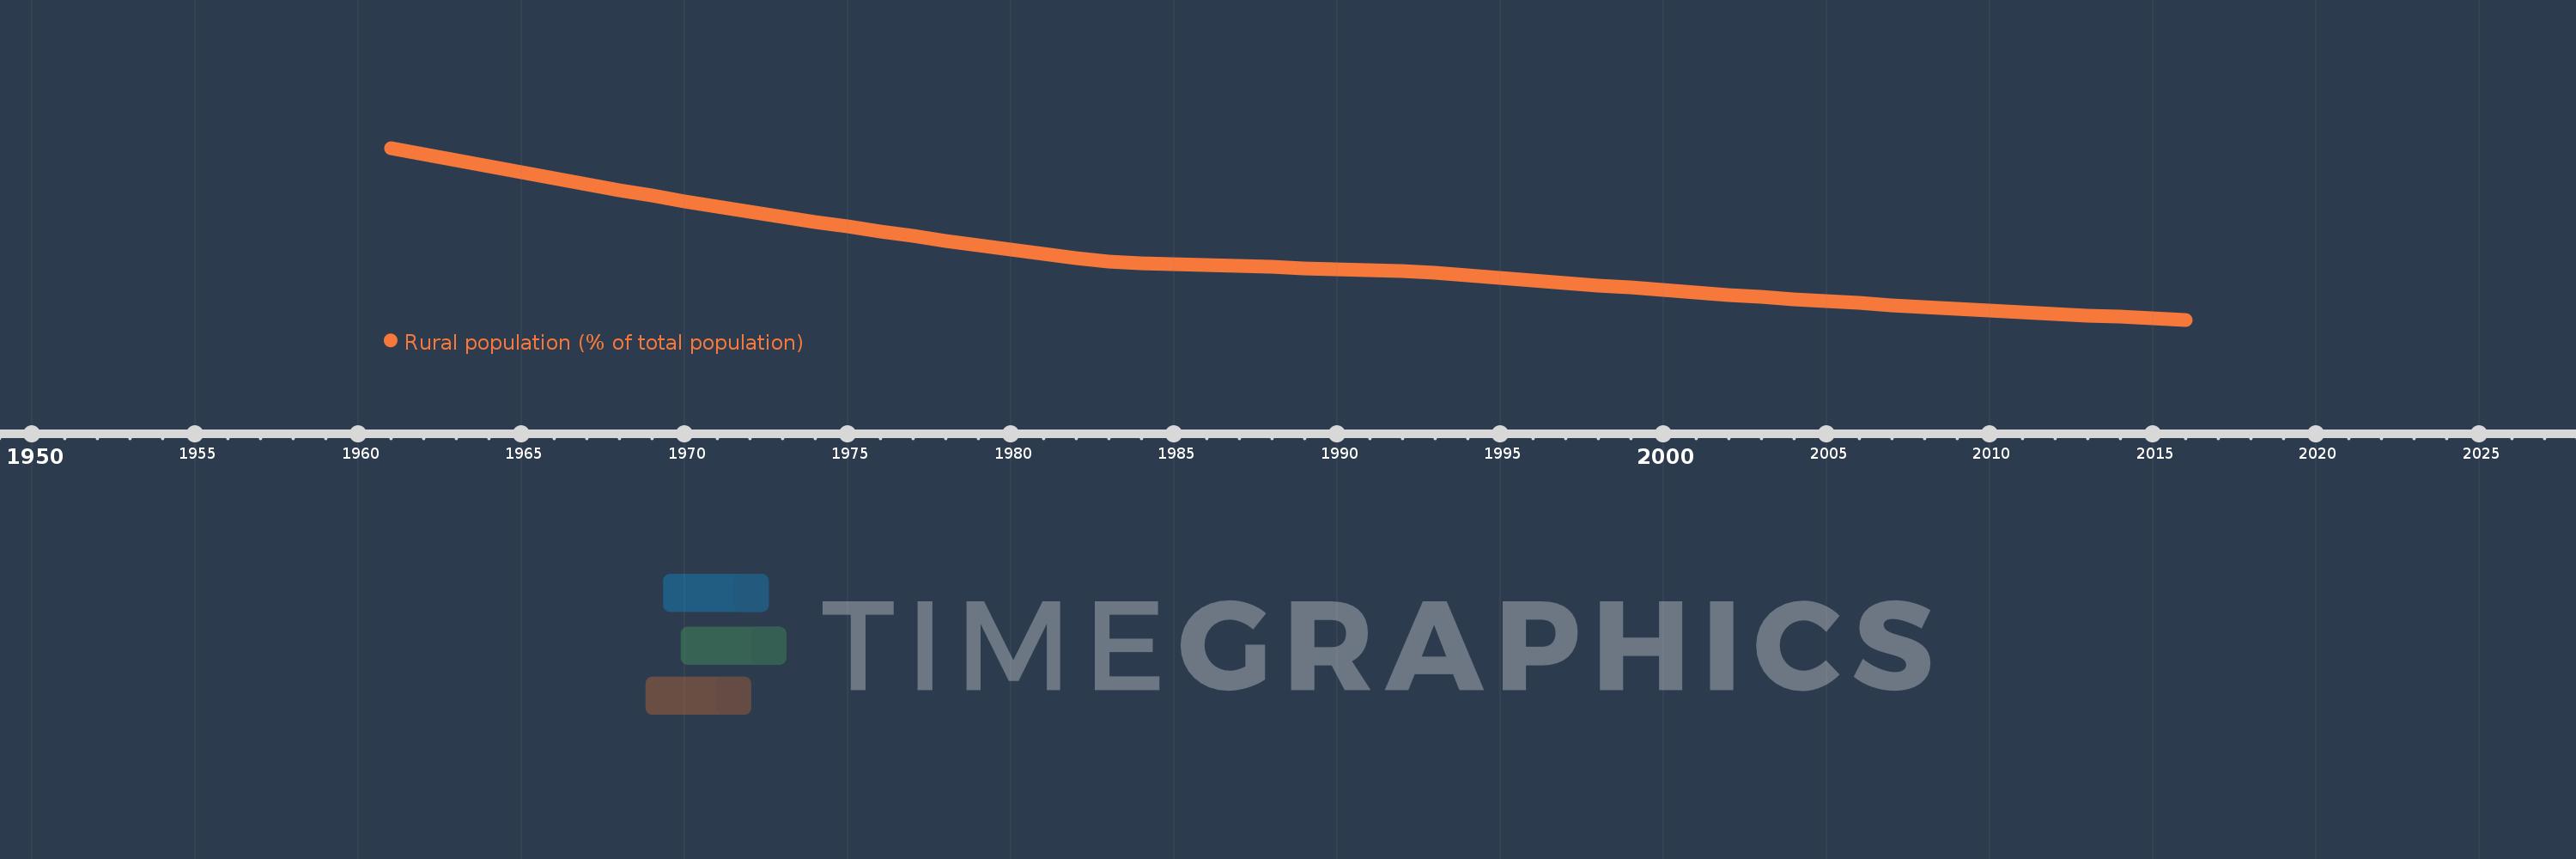
Rural population (% of total population)
2016,2015,2014,2013,2012,2011,2010,2009,2008,2007,2006,2005,2004,2003,2002,2001,2000,1999,1998,1997,1996,1995,1994,1993,1992,1991,1990,1989,1988,1987,1986,1985,1984,1983,1982,1981,1980,1979,1978,1977,1976,1975,1974,1973,1972,1971,1970,1969,1968,1967,1966,1965,1964,1963,1962,1961
This statistics in other country:
AfghanistanAlbaniaAlgeriaAmerican SamoaAndorraAngolaAntigua and BarbudaArab WorldArgentinaArmeniaArubaAustraliaAustriaAzerbaijanBahamas, TheBahrainBangladeshBarbadosBelarusBelgiumBelizeBeninBermudaBhutanBoliviaBosnia and HerzegovinaBotswanaBrazilBritish Virgin IslandsBrunei DarussalamBulgariaBurkina FasoBurundiCabo VerdeCambodiaCameroonCanadaCaribbean small statesCayman IslandsCentral African RepublicCentral Europe and the BalticsChadChannel IslandsChileChinaColombiaComorosCongo, Dem. Rep.Congo, Rep.Costa RicaCote d'IvoireCroatiaCubaCuracaoCyprusCzech RepublicDenmarkDjiboutiDominicaDominican RepublicEarly-demographic dividendEast Asia & PacificEast Asia & Pacific (excluding high income)East Asia & Pacific (IDA & IBRD countries)EcuadorEgypt, Arab Rep.El SalvadorEquatorial GuineaEritreaEstoniaEthiopiaEuro areaEurope & Central AsiaEurope & Central Asia (excluding high income)Europe & Central Asia (IDA & IBRD countries)European UnionFaroe IslandsFijiFinlandFragile and conflict affected situationsFranceFrench PolynesiaGabonGambia, TheGeorgiaGermanyGhanaGibraltarGreeceGreenlandGrenadaGuamGuatemalaGuineaGuinea-BissauGuyanaHaitiHeavily indebted poor countries (HIPC)High incomeHondurasHong Kong SAR, ChinaHungaryIBRD onlyIcelandIDA & IBRD totalIDA blendIDA onlyIDA totalIndiaIndonesiaIran, Islamic Rep.IraqIrelandIsle of ManIsraelItalyJamaicaJapanJordanKazakhstanKenyaKiribatiKorea, Dem. People’s Rep.Korea, Rep.KuwaitKyrgyz RepublicLao PDRLate-demographic dividendLatin America & Caribbean Latin America & Caribbean (excluding high income)Latin America & the Caribbean (IDA & IBRD countries)LatviaLeast developed countries: UN classificationLebanonLesothoLiberiaLibyaLiechtensteinLithuaniaLow & middle incomeLow incomeLower middle incomeLuxembourgMacao SAR, ChinaMacedonia, FYRMadagascarMalawiMalaysiaMaldivesMaliMaltaMarshall IslandsMauritaniaMauritiusMexicoMicronesia, Fed. Sts.Middle East & North AfricaMiddle East & North Africa (excluding high income)Middle East & North Africa (IDA & IBRD countries)Middle incomeMoldovaMonacoMongoliaMontenegroMoroccoMozambiqueMyanmarNamibiaNauruNepalNetherlandsNew CaledoniaNew ZealandNicaraguaNigerNigeriaNorth AmericaNorthern Mariana IslandsNorwayOECD membersOmanOther small statesPacific island small statesPakistanPalauPanamaPapua New GuineaParaguayPeruPhilippinesPolandPortugalPost-demographic dividendPre-demographic dividendPuerto RicoQatarRomaniaRussian FederationRwandaSamoaSan MarinoSao Tome and PrincipeSaudi ArabiaSenegalSerbiaSeychellesSierra LeoneSingaporeSint Maarten (Dutch part)Slovak RepublicSloveniaSmall statesSolomon IslandsSomaliaSouth AfricaSouth AsiaSouth Asia (IDA & IBRD)South SudanSpainSri LankaSt. Kitts and NevisSt. LuciaSt. Vincent and the GrenadinesSub-Saharan Africa Sub-Saharan Africa (excluding high income)Sub-Saharan Africa (IDA & IBRD countries)SudanSurinameSwazilandSwedenSwitzerlandSyrian Arab RepublicTajikistanTanzaniaThailandTimor-LesteTogoTongaTrinidad and TobagoTunisiaTurkeyTurkmenistanTurks and Caicos IslandsTuvaluUgandaUkraineUnited Arab EmiratesUnited KingdomUnited StatesUpper middle incomeUruguayUzbekistanVanuatuVenezuela, RBVietnamVirgin Islands (U.S.)West Bank and GazaWorldYemen, Rep.ZambiaZimbabwe Timeline:
This timeline shows a graph from 1961 to 2016 of Chile. No data until 1960. Number of actual observations by date: 56.
Source name:
World Development Indicators
Source organization:
World Bank Staff estimates based on United Nations, World Urbanization Prospects.
Categories, topics:
Agriculture & Rural Development
Last updated:
apr 23, 2017
Indicators value changes by year
Maximum:
32.164
jan 1, 1961
At the date of observation
Value
Absolute change
Change from previous value
jan 1, 1961
32.164
+32.164
0.0%
jan 1, 1962
31.34
-0.824
-2.56%
jan 1, 1963
30.565
-0.775
-2.47%
jan 1, 1964
29.8
-0.765
-2.5%
jan 1, 1965
29.045
-0.755
-2.53%
jan 1, 1966
28.304
-0.741
-2.55%
jan 1, 1967
27.573
-0.731
-2.58%
jan 1, 1968
26.854
-0.719
-2.61%
jan 1, 1969
26.146
-0.708
-2.64%
jan 1, 1970
25.453
-0.693
-2.65%
jan 1, 1971
24.773
-0.68
-2.67%
jan 1, 1972
24.117
-0.656
-2.65%
jan 1, 1973
23.472
-0.645
-2.67%
jan 1, 1974
22.841
-0.631
-2.69%
jan 1, 1975
22.222
-0.619
-2.71%
jan 1, 1976
21.614
-0.608
-2.74%
jan 1, 1977
21.018
-0.596
-2.76%
jan 1, 1978
20.435
-0.583
-2.77%
jan 1, 1979
19.864
-0.571
-2.79%
jan 1, 1980
19.305
-0.559
-2.81%
jan 1, 1981
18.757
-0.548
-2.84%
jan 1, 1982
18.222
-0.535
-2.85%
jan 1, 1983
17.774
-0.448
-2.46%
jan 1, 1984
17.641
-0.133
-0.75%
jan 1, 1985
17.508
-0.133
-0.75%
jan 1, 1986
17.376
-0.132
-0.75%
jan 1, 1987
17.245
-0.131
-0.75%
jan 1, 1988
17.115
-0.13
-0.75%
jan 1, 1989
16.986
-0.129
-0.75%
jan 1, 1990
16.857
-0.129
-0.76%
jan 1, 1991
16.729
-0.128
-0.76%
jan 1, 1992
16.602
-0.127
-0.76%
jan 1, 1993
16.436
-0.166
-1.0%
jan 1, 1994
16.104
-0.332
-2.02%
jan 1, 1995
15.777
-0.327
-2.03%
jan 1, 1996
15.455
-0.322
-2.04%
jan 1, 1997
15.139
-0.316
-2.04%
jan 1, 1998
14.828
-0.311
-2.05%
jan 1, 1999
14.523
-0.305
-2.06%
jan 1, 2000
14.222
-0.301
-2.07%
jan 1, 2001
13.927
-0.295
-2.07%
jan 1, 2002
13.637
-0.29
-2.08%
jan 1, 2003
13.352
-0.285
-2.09%
jan 1, 2004
13.078
-0.274
-2.05%
jan 1, 2005
12.813
-0.265
-2.03%
jan 1, 2006
12.557
-0.256
-2.0%
jan 1, 2007
12.311
-0.246
-1.96%
jan 1, 2008
12.074
-0.237
-1.93%
jan 1, 2009
11.845
-0.229
-1.9%
jan 1, 2010
11.625
-0.22
-1.86%
jan 1, 2011
11.414
-0.211
-1.82%
jan 1, 2012
11.21
-0.204
-1.79%
jan 1, 2013
11.014
-0.196
-1.75%
jan 1, 2014
10.825
-0.189
-1.72%
jan 1, 2015
10.644
-0.181
-1.67%
jan 1, 2016
10.47
-0.174
-1.63%
Ranking of countries by current statistics by years


Comments: