29
/
en
AIzaSyAYiBZKx7MnpbEhh9jyipgxe19OcubqV5w
April 1, 2024
39525
IDA only
IDX
false
2
1
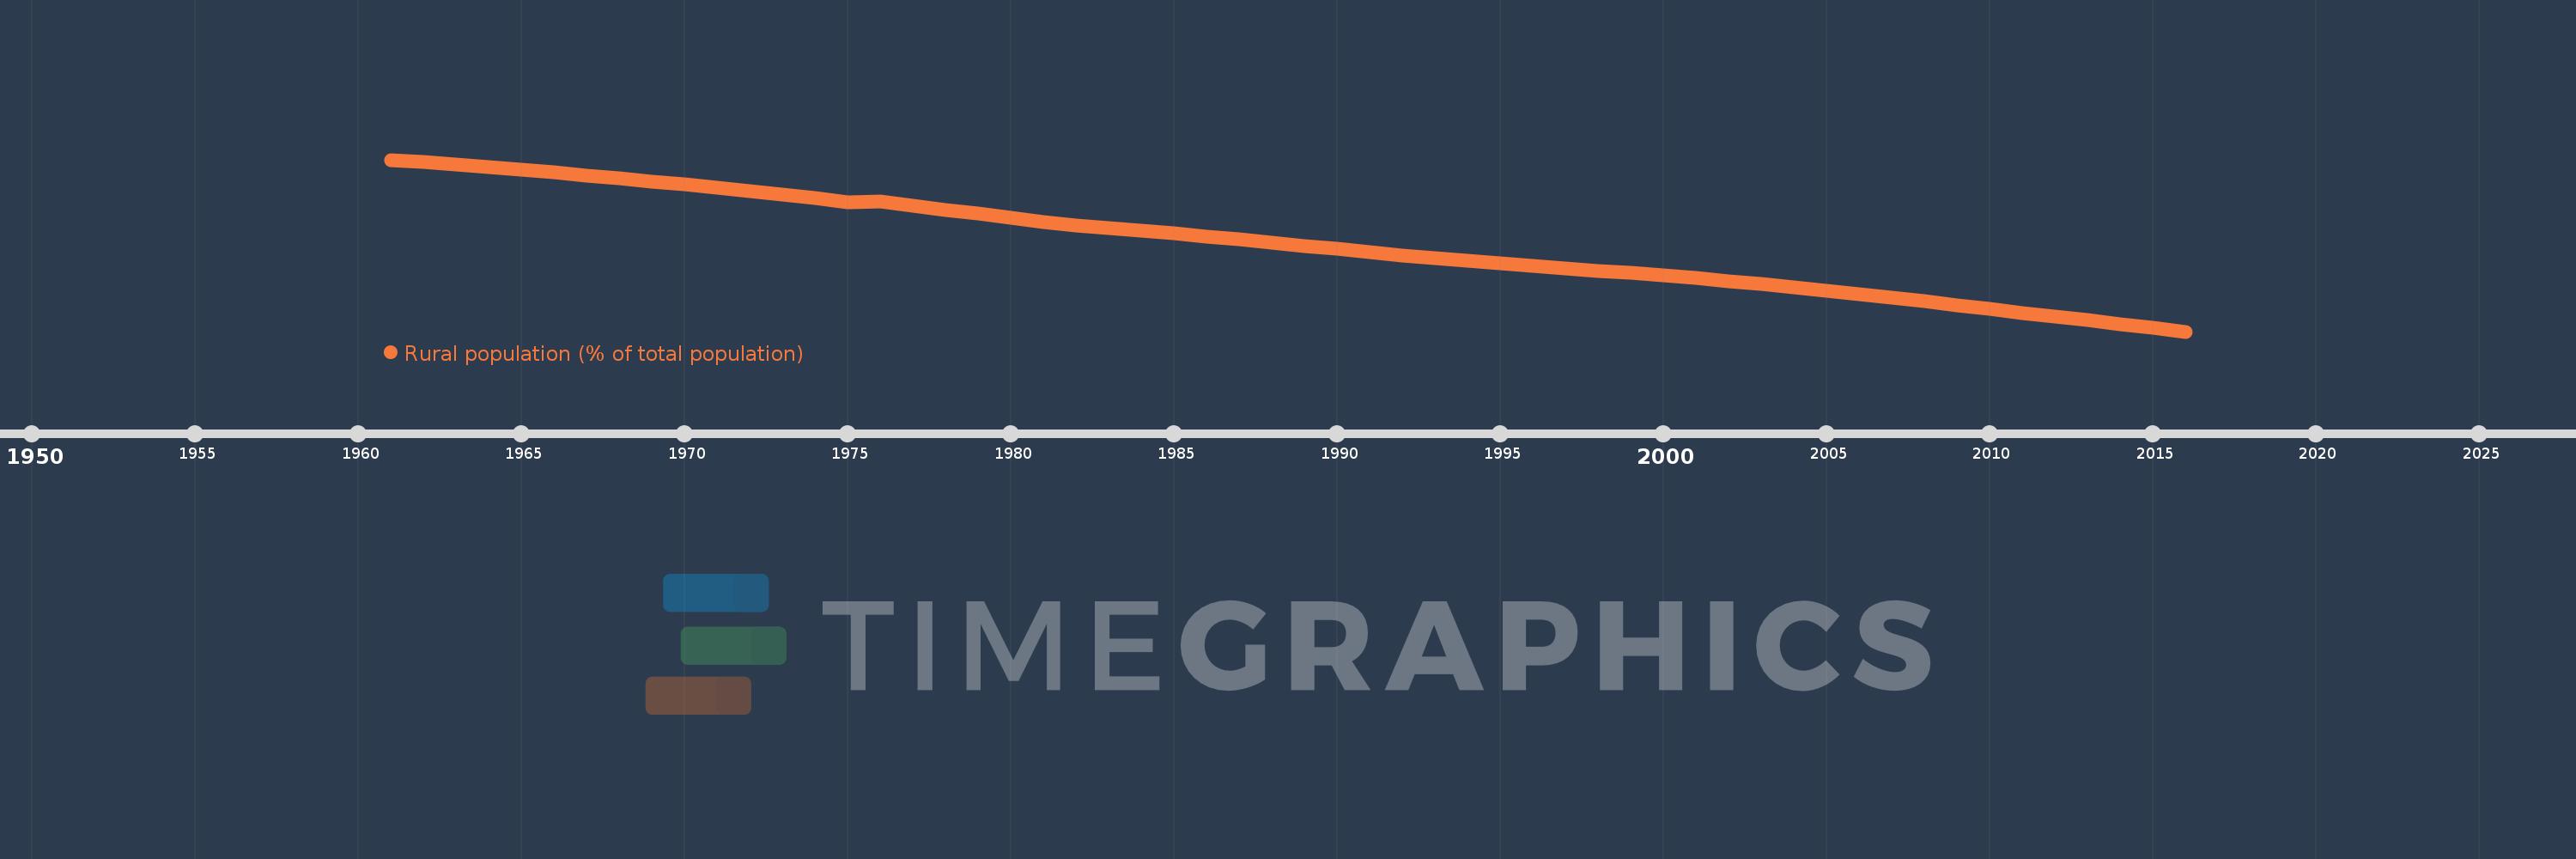
Rural population (% of total population)
2016,2015,2014,2013,2012,2011,2010,2009,2008,2007,2006,2005,2004,2003,2002,2001,2000,1999,1998,1997,1996,1995,1994,1993,1992,1991,1990,1989,1988,1987,1986,1985,1984,1983,1982,1981,1980,1979,1978,1977,1976,1975,1974,1973,1972,1971,1970,1969,1968,1967,1966,1965,1964,1963,1962,1961
This statistics in other country:
AfghanistanAlbaniaAlgeriaAmerican SamoaAndorraAngolaAntigua and BarbudaArab WorldArgentinaArmeniaArubaAustraliaAustriaAzerbaijanBahamas, TheBahrainBangladeshBarbadosBelarusBelgiumBelizeBeninBermudaBhutanBoliviaBosnia and HerzegovinaBotswanaBrazilBritish Virgin IslandsBrunei DarussalamBulgariaBurkina FasoBurundiCabo VerdeCambodiaCameroonCanadaCaribbean small statesCayman IslandsCentral African RepublicCentral Europe and the BalticsChadChannel IslandsChileChinaColombiaComorosCongo, Dem. Rep.Congo, Rep.Costa RicaCote d'IvoireCroatiaCubaCuracaoCyprusCzech RepublicDenmarkDjiboutiDominicaDominican RepublicEarly-demographic dividendEast Asia & PacificEast Asia & Pacific (excluding high income)East Asia & Pacific (IDA & IBRD countries)EcuadorEgypt, Arab Rep.El SalvadorEquatorial GuineaEritreaEstoniaEthiopiaEuro areaEurope & Central AsiaEurope & Central Asia (excluding high income)Europe & Central Asia (IDA & IBRD countries)European UnionFaroe IslandsFijiFinlandFragile and conflict affected situationsFranceFrench PolynesiaGabonGambia, TheGeorgiaGermanyGhanaGibraltarGreeceGreenlandGrenadaGuamGuatemalaGuineaGuinea-BissauGuyanaHaitiHeavily indebted poor countries (HIPC)High incomeHondurasHong Kong SAR, ChinaHungaryIBRD onlyIcelandIDA & IBRD totalIDA blendIDA onlyIDA totalIndiaIndonesiaIran, Islamic Rep.IraqIrelandIsle of ManIsraelItalyJamaicaJapanJordanKazakhstanKenyaKiribatiKorea, Dem. People’s Rep.Korea, Rep.KuwaitKyrgyz RepublicLao PDRLate-demographic dividendLatin America & Caribbean Latin America & Caribbean (excluding high income)Latin America & the Caribbean (IDA & IBRD countries)LatviaLeast developed countries: UN classificationLebanonLesothoLiberiaLibyaLiechtensteinLithuaniaLow & middle incomeLow incomeLower middle incomeLuxembourgMacao SAR, ChinaMacedonia, FYRMadagascarMalawiMalaysiaMaldivesMaliMaltaMarshall IslandsMauritaniaMauritiusMexicoMicronesia, Fed. Sts.Middle East & North AfricaMiddle East & North Africa (excluding high income)Middle East & North Africa (IDA & IBRD countries)Middle incomeMoldovaMonacoMongoliaMontenegroMoroccoMozambiqueMyanmarNamibiaNauruNepalNetherlandsNew CaledoniaNew ZealandNicaraguaNigerNigeriaNorth AmericaNorthern Mariana IslandsNorwayOECD membersOmanOther small statesPacific island small statesPakistanPalauPanamaPapua New GuineaParaguayPeruPhilippinesPolandPortugalPost-demographic dividendPre-demographic dividendPuerto RicoQatarRomaniaRussian FederationRwandaSamoaSan MarinoSao Tome and PrincipeSaudi ArabiaSenegalSerbiaSeychellesSierra LeoneSingaporeSint Maarten (Dutch part)Slovak RepublicSloveniaSmall statesSolomon IslandsSomaliaSouth AfricaSouth AsiaSouth Asia (IDA & IBRD)South SudanSpainSri LankaSt. Kitts and NevisSt. LuciaSt. Vincent and the GrenadinesSub-Saharan Africa Sub-Saharan Africa (excluding high income)Sub-Saharan Africa (IDA & IBRD countries)SudanSurinameSwazilandSwedenSwitzerlandSyrian Arab RepublicTajikistanTanzaniaThailandTimor-LesteTogoTongaTrinidad and TobagoTunisiaTurkeyTurkmenistanTurks and Caicos IslandsTuvaluUgandaUkraineUnited Arab EmiratesUnited KingdomUnited StatesUpper middle incomeUruguayUzbekistanVanuatuVenezuela, RBVietnamVirgin Islands (U.S.)West Bank and GazaWorldYemen, Rep.ZambiaZimbabwe Timeline:
This timeline shows a graph from 1961 to 2016 of IDA only. No data until 1960. Number of actual observations by date: 56.
Source name:
World Development Indicators
Source organization:
World Bank Staff estimates based on United Nations, World Urbanization Prospects.
Categories, topics:
Agriculture & Rural Development
Last updated:
apr 23, 2017
Indicators value changes by year
Minimum:
67.195
jan 1, 2016
At the date of observation
Value
Absolute change
Change from previous value
jan 1, 1961
88.84
+88.84
0.0%
jan 1, 1962
88.552
-0.288
-0.32%
jan 1, 1963
88.243
-0.309
-0.35%
jan 1, 1964
87.918
-0.325
-0.37%
jan 1, 1965
87.576
-0.341
-0.39%
jan 1, 1966
87.227
-0.35
-0.4%
jan 1, 1967
86.88
-0.346
-0.4%
jan 1, 1968
86.505
-0.375
-0.43%
jan 1, 1969
86.116
-0.388
-0.45%
jan 1, 1970
85.711
-0.405
-0.47%
jan 1, 1971
85.306
-0.405
-0.47%
jan 1, 1972
84.879
-0.426
-0.5%
jan 1, 1973
84.432
-0.447
-0.53%
jan 1, 1974
83.979
-0.453
-0.54%
jan 1, 1975
83.521
-0.458
-0.55%
jan 1, 1976
83.553
+0.032
0.04%
jan 1, 1977
83.064
-0.488
-0.58%
jan 1, 1978
82.557
-0.507
-0.61%
jan 1, 1979
82.034
-0.524
-0.63%
jan 1, 1980
81.547
-0.487
-0.59%
jan 1, 1981
81.024
-0.523
-0.64%
jan 1, 1982
80.569
-0.455
-0.56%
jan 1, 1983
80.256
-0.313
-0.39%
jan 1, 1984
79.922
-0.334
-0.42%
jan 1, 1985
79.56
-0.362
-0.45%
jan 1, 1986
79.172
-0.388
-0.49%
jan 1, 1987
78.783
-0.389
-0.49%
jan 1, 1988
78.393
-0.39
-0.5%
jan 1, 1989
77.997
-0.396
-0.51%
jan 1, 1990
77.606
-0.391
-0.5%
jan 1, 1991
77.198
-0.408
-0.53%
jan 1, 1992
76.813
-0.384
-0.5%
jan 1, 1993
76.45
-0.363
-0.47%
jan 1, 1994
76.098
-0.352
-0.46%
jan 1, 1995
75.789
-0.309
-0.41%
jan 1, 1996
75.483
-0.306
-0.4%
jan 1, 1997
75.178
-0.305
-0.4%
jan 1, 1998
74.865
-0.313
-0.42%
jan 1, 1999
74.558
-0.307
-0.41%
jan 1, 2000
74.248
-0.31
-0.42%
jan 1, 2001
73.927
-0.321
-0.43%
jan 1, 2002
73.562
-0.365
-0.49%
jan 1, 2003
73.17
-0.392
-0.53%
jan 1, 2004
72.761
-0.41
-0.56%
jan 1, 2005
72.339
-0.422
-0.58%
jan 1, 2006
71.902
-0.437
-0.6%
jan 1, 2007
71.454
-0.448
-0.62%
jan 1, 2008
70.993
-0.461
-0.64%
jan 1, 2009
70.512
-0.481
-0.68%
jan 1, 2010
70.033
-0.48
-0.68%
jan 1, 2011
69.557
-0.476
-0.68%
jan 1, 2012
69.087
-0.47
-0.68%
jan 1, 2013
68.62
-0.467
-0.68%
jan 1, 2014
68.153
-0.467
-0.68%
jan 1, 2015
67.68
-0.474
-0.7%
jan 1, 2016
67.195
-0.485
-0.72%
Ranking of countries by current statistics by years


Comments: