29
/
en
AIzaSyAYiBZKx7MnpbEhh9jyipgxe19OcubqV5w
April 1, 2024
42970
Latin America & Caribbean (excluding high income)
LAC
false
2
1
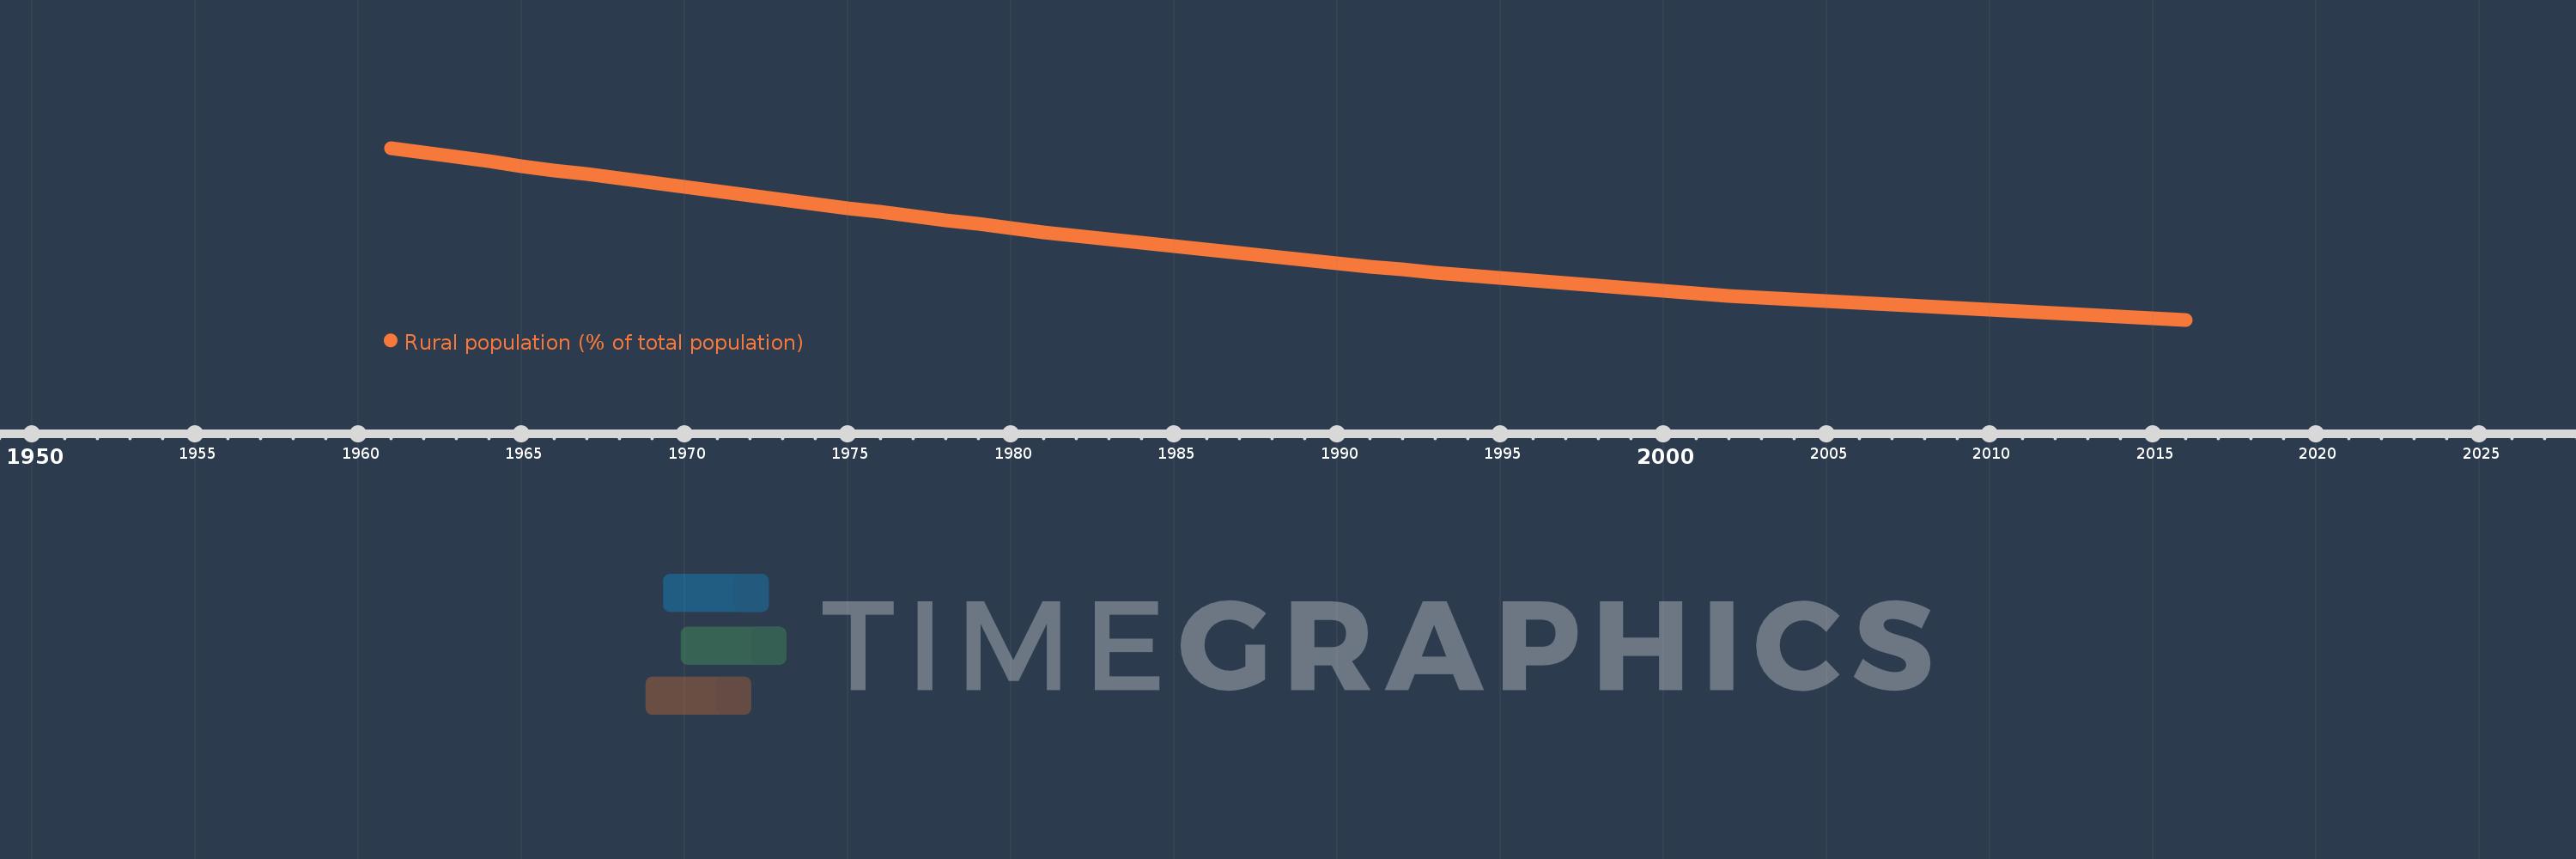
Rural population (% of total population)
2016,2015,2014,2013,2012,2011,2010,2009,2008,2007,2006,2005,2004,2003,2002,2001,2000,1999,1998,1997,1996,1995,1994,1993,1992,1991,1990,1989,1988,1987,1986,1985,1984,1983,1982,1981,1980,1979,1978,1977,1976,1975,1974,1973,1972,1971,1970,1969,1968,1967,1966,1965,1964,1963,1962,1961
This statistics in other country:
AfghanistanAlbaniaAlgeriaAmerican SamoaAndorraAngolaAntigua and BarbudaArab WorldArgentinaArmeniaArubaAustraliaAustriaAzerbaijanBahamas, TheBahrainBangladeshBarbadosBelarusBelgiumBelizeBeninBermudaBhutanBoliviaBosnia and HerzegovinaBotswanaBrazilBritish Virgin IslandsBrunei DarussalamBulgariaBurkina FasoBurundiCabo VerdeCambodiaCameroonCanadaCaribbean small statesCayman IslandsCentral African RepublicCentral Europe and the BalticsChadChannel IslandsChileChinaColombiaComorosCongo, Dem. Rep.Congo, Rep.Costa RicaCote d'IvoireCroatiaCubaCuracaoCyprusCzech RepublicDenmarkDjiboutiDominicaDominican RepublicEarly-demographic dividendEast Asia & PacificEast Asia & Pacific (excluding high income)East Asia & Pacific (IDA & IBRD countries)EcuadorEgypt, Arab Rep.El SalvadorEquatorial GuineaEritreaEstoniaEthiopiaEuro areaEurope & Central AsiaEurope & Central Asia (excluding high income)Europe & Central Asia (IDA & IBRD countries)European UnionFaroe IslandsFijiFinlandFragile and conflict affected situationsFranceFrench PolynesiaGabonGambia, TheGeorgiaGermanyGhanaGibraltarGreeceGreenlandGrenadaGuamGuatemalaGuineaGuinea-BissauGuyanaHaitiHeavily indebted poor countries (HIPC)High incomeHondurasHong Kong SAR, ChinaHungaryIBRD onlyIcelandIDA & IBRD totalIDA blendIDA onlyIDA totalIndiaIndonesiaIran, Islamic Rep.IraqIrelandIsle of ManIsraelItalyJamaicaJapanJordanKazakhstanKenyaKiribatiKorea, Dem. People’s Rep.Korea, Rep.KuwaitKyrgyz RepublicLao PDRLate-demographic dividendLatin America & Caribbean Latin America & Caribbean (excluding high income)Latin America & the Caribbean (IDA & IBRD countries)LatviaLeast developed countries: UN classificationLebanonLesothoLiberiaLibyaLiechtensteinLithuaniaLow & middle incomeLow incomeLower middle incomeLuxembourgMacao SAR, ChinaMacedonia, FYRMadagascarMalawiMalaysiaMaldivesMaliMaltaMarshall IslandsMauritaniaMauritiusMexicoMicronesia, Fed. Sts.Middle East & North AfricaMiddle East & North Africa (excluding high income)Middle East & North Africa (IDA & IBRD countries)Middle incomeMoldovaMonacoMongoliaMontenegroMoroccoMozambiqueMyanmarNamibiaNauruNepalNetherlandsNew CaledoniaNew ZealandNicaraguaNigerNigeriaNorth AmericaNorthern Mariana IslandsNorwayOECD membersOmanOther small statesPacific island small statesPakistanPalauPanamaPapua New GuineaParaguayPeruPhilippinesPolandPortugalPost-demographic dividendPre-demographic dividendPuerto RicoQatarRomaniaRussian FederationRwandaSamoaSan MarinoSao Tome and PrincipeSaudi ArabiaSenegalSerbiaSeychellesSierra LeoneSingaporeSint Maarten (Dutch part)Slovak RepublicSloveniaSmall statesSolomon IslandsSomaliaSouth AfricaSouth AsiaSouth Asia (IDA & IBRD)South SudanSpainSri LankaSt. Kitts and NevisSt. LuciaSt. Vincent and the GrenadinesSub-Saharan Africa Sub-Saharan Africa (excluding high income)Sub-Saharan Africa (IDA & IBRD countries)SudanSurinameSwazilandSwedenSwitzerlandSyrian Arab RepublicTajikistanTanzaniaThailandTimor-LesteTogoTongaTrinidad and TobagoTunisiaTurkeyTurkmenistanTurks and Caicos IslandsTuvaluUgandaUkraineUnited Arab EmiratesUnited KingdomUnited StatesUpper middle incomeUruguayUzbekistanVanuatuVenezuela, RBVietnamVirgin Islands (U.S.)West Bank and GazaWorldYemen, Rep.ZambiaZimbabwe Timeline:
This timeline shows a graph from 1961 to 2016 of Latin America & Caribbean (excluding high income). No data until 1960. Number of actual observations by date: 56.
Source name:
World Development Indicators
Source organization:
World Bank Staff estimates based on United Nations, World Urbanization Prospects.
Categories, topics:
Agriculture & Rural Development
Last updated:
apr 23, 2017
Indicators value changes by year
Minimum:
20.378
jan 1, 2016
Maximum:
51.605
jan 1, 1961
At the date of observation
Value
Absolute change
Change from previous value
jan 1, 1961
51.605
+51.605
0.0%
jan 1, 1962
50.802
-0.802
-1.55%
jan 1, 1963
49.987
-0.815
-1.6%
jan 1, 1964
49.17
-0.817
-1.64%
jan 1, 1965
48.347
-0.823
-1.67%
jan 1, 1966
47.573
-0.773
-1.6%
jan 1, 1967
46.8
-0.773
-1.63%
jan 1, 1968
46.027
-0.772
-1.65%
jan 1, 1969
45.254
-0.774
-1.68%
jan 1, 1970
44.483
-0.771
-1.7%
jan 1, 1971
43.715
-0.768
-1.73%
jan 1, 1972
42.937
-0.778
-1.78%
jan 1, 1973
42.164
-0.772
-1.8%
jan 1, 1974
41.417
-0.747
-1.77%
jan 1, 1975
40.679
-0.738
-1.78%
jan 1, 1976
39.942
-0.737
-1.81%
jan 1, 1977
39.212
-0.73
-1.83%
jan 1, 1978
38.483
-0.729
-1.86%
jan 1, 1979
37.757
-0.726
-1.89%
jan 1, 1980
37.039
-0.719
-1.9%
jan 1, 1981
36.329
-0.71
-1.92%
jan 1, 1982
35.655
-0.674
-1.85%
jan 1, 1983
35.006
-0.649
-1.82%
jan 1, 1984
34.362
-0.643
-1.84%
jan 1, 1985
33.723
-0.639
-1.86%
jan 1, 1986
33.088
-0.635
-1.88%
jan 1, 1987
32.465
-0.623
-1.88%
jan 1, 1988
31.852
-0.613
-1.89%
jan 1, 1989
31.245
-0.607
-1.91%
jan 1, 1990
30.649
-0.595
-1.91%
jan 1, 1991
30.067
-0.582
-1.9%
jan 1, 1992
29.515
-0.553
-1.84%
jan 1, 1993
28.988
-0.527
-1.79%
jan 1, 1994
28.479
-0.509
-1.76%
jan 1, 1995
27.975
-0.504
-1.77%
jan 1, 1996
27.48
-0.495
-1.77%
jan 1, 1997
27.009
-0.471
-1.71%
jan 1, 1998
26.528
-0.481
-1.78%
jan 1, 1999
26.051
-0.477
-1.8%
jan 1, 2000
25.589
-0.462
-1.77%
jan 1, 2001
25.129
-0.46
-1.8%
jan 1, 2002
24.759
-0.37
-1.47%
jan 1, 2003
24.413
-0.346
-1.4%
jan 1, 2004
24.074
-0.339
-1.39%
jan 1, 2005
23.738
-0.337
-1.4%
jan 1, 2006
23.407
-0.33
-1.39%
jan 1, 2007
23.081
-0.326
-1.39%
jan 1, 2008
22.761
-0.32
-1.39%
jan 1, 2009
22.445
-0.316
-1.39%
jan 1, 2010
22.134
-0.311
-1.38%
jan 1, 2011
21.827
-0.307
-1.39%
jan 1, 2012
21.524
-0.303
-1.39%
jan 1, 2013
21.228
-0.296
-1.38%
jan 1, 2014
20.938
-0.29
-1.36%
jan 1, 2015
20.654
-0.283
-1.35%
jan 1, 2016
20.378
-0.277
-1.34%
Ranking of countries by current statistics by years


Comments: