29
/
en
AIzaSyAYiBZKx7MnpbEhh9jyipgxe19OcubqV5w
April 1, 2024
35357
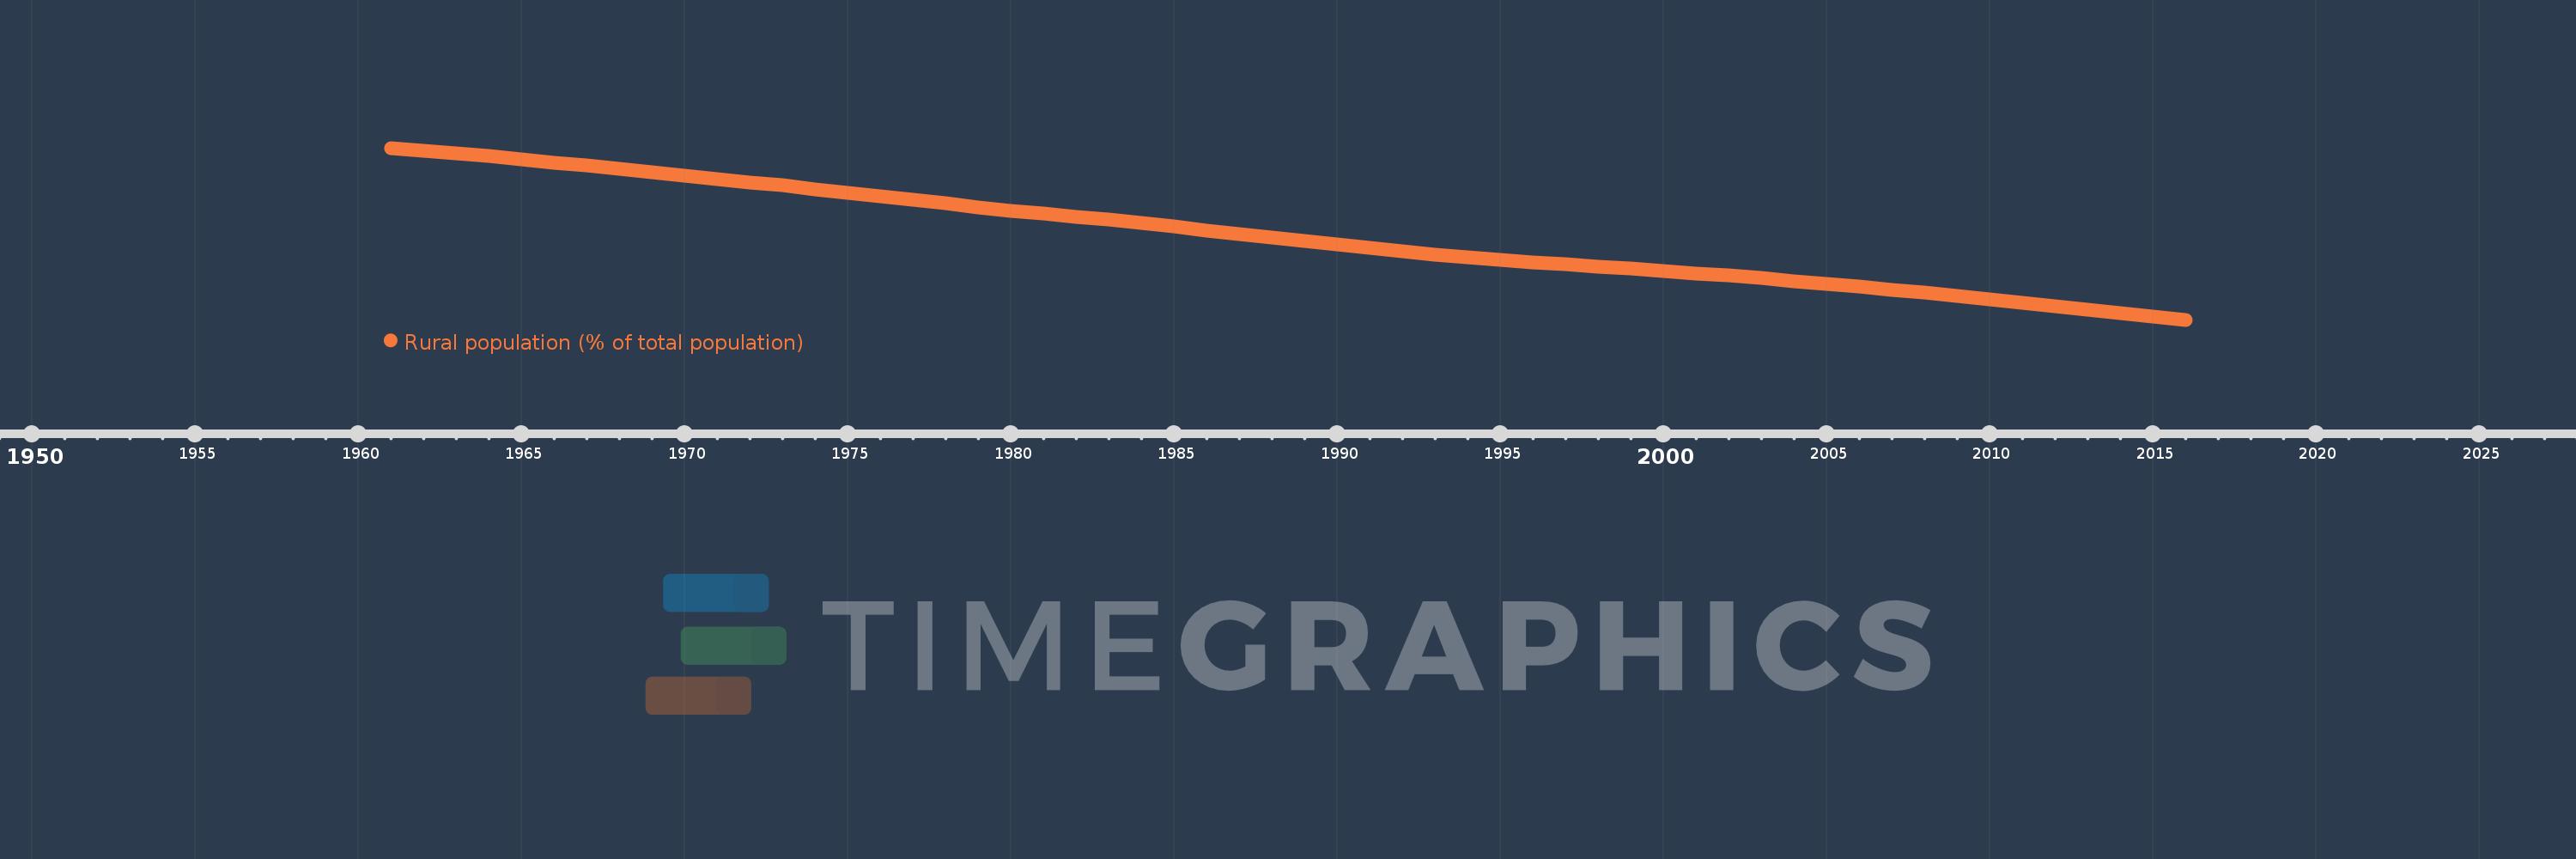
Heavily indebted poor countries (HIPC)
HPC
false
2
1
Rural population (% of total population)
2016,2015,2014,2013,2012,2011,2010,2009,2008,2007,2006,2005,2004,2003,2002,2001,2000,1999,1998,1997,1996,1995,1994,1993,1992,1991,1990,1989,1988,1987,1986,1985,1984,1983,1982,1981,1980,1979,1978,1977,1976,1975,1974,1973,1972,1971,1970,1969,1968,1967,1966,1965,1964,1963,1962,1961
This statistics in other country:
AfghanistanAlbaniaAlgeriaAmerican SamoaAndorraAngolaAntigua and BarbudaArab WorldArgentinaArmeniaArubaAustraliaAustriaAzerbaijanBahamas, TheBahrainBangladeshBarbadosBelarusBelgiumBelizeBeninBermudaBhutanBoliviaBosnia and HerzegovinaBotswanaBrazilBritish Virgin IslandsBrunei DarussalamBulgariaBurkina FasoBurundiCabo VerdeCambodiaCameroonCanadaCaribbean small statesCayman IslandsCentral African RepublicCentral Europe and the BalticsChadChannel IslandsChileChinaColombiaComorosCongo, Dem. Rep.Congo, Rep.Costa RicaCote d'IvoireCroatiaCubaCuracaoCyprusCzech RepublicDenmarkDjiboutiDominicaDominican RepublicEarly-demographic dividendEast Asia & PacificEast Asia & Pacific (excluding high income)East Asia & Pacific (IDA & IBRD countries)EcuadorEgypt, Arab Rep.El SalvadorEquatorial GuineaEritreaEstoniaEthiopiaEuro areaEurope & Central AsiaEurope & Central Asia (excluding high income)Europe & Central Asia (IDA & IBRD countries)European UnionFaroe IslandsFijiFinlandFragile and conflict affected situationsFranceFrench PolynesiaGabonGambia, TheGeorgiaGermanyGhanaGibraltarGreeceGreenlandGrenadaGuamGuatemalaGuineaGuinea-BissauGuyanaHaitiHeavily indebted poor countries (HIPC)High incomeHondurasHong Kong SAR, ChinaHungaryIBRD onlyIcelandIDA & IBRD totalIDA blendIDA onlyIDA totalIndiaIndonesiaIran, Islamic Rep.IraqIrelandIsle of ManIsraelItalyJamaicaJapanJordanKazakhstanKenyaKiribatiKorea, Dem. People’s Rep.Korea, Rep.KuwaitKyrgyz RepublicLao PDRLate-demographic dividendLatin America & Caribbean Latin America & Caribbean (excluding high income)Latin America & the Caribbean (IDA & IBRD countries)LatviaLeast developed countries: UN classificationLebanonLesothoLiberiaLibyaLiechtensteinLithuaniaLow & middle incomeLow incomeLower middle incomeLuxembourgMacao SAR, ChinaMacedonia, FYRMadagascarMalawiMalaysiaMaldivesMaliMaltaMarshall IslandsMauritaniaMauritiusMexicoMicronesia, Fed. Sts.Middle East & North AfricaMiddle East & North Africa (excluding high income)Middle East & North Africa (IDA & IBRD countries)Middle incomeMoldovaMonacoMongoliaMontenegroMoroccoMozambiqueMyanmarNamibiaNauruNepalNetherlandsNew CaledoniaNew ZealandNicaraguaNigerNigeriaNorth AmericaNorthern Mariana IslandsNorwayOECD membersOmanOther small statesPacific island small statesPakistanPalauPanamaPapua New GuineaParaguayPeruPhilippinesPolandPortugalPost-demographic dividendPre-demographic dividendPuerto RicoQatarRomaniaRussian FederationRwandaSamoaSan MarinoSao Tome and PrincipeSaudi ArabiaSenegalSerbiaSeychellesSierra LeoneSingaporeSint Maarten (Dutch part)Slovak RepublicSloveniaSmall statesSolomon IslandsSomaliaSouth AfricaSouth AsiaSouth Asia (IDA & IBRD)South SudanSpainSri LankaSt. Kitts and NevisSt. LuciaSt. Vincent and the GrenadinesSub-Saharan Africa Sub-Saharan Africa (excluding high income)Sub-Saharan Africa (IDA & IBRD countries)SudanSurinameSwazilandSwedenSwitzerlandSyrian Arab RepublicTajikistanTanzaniaThailandTimor-LesteTogoTongaTrinidad and TobagoTunisiaTurkeyTurkmenistanTurks and Caicos IslandsTuvaluUgandaUkraineUnited Arab EmiratesUnited KingdomUnited StatesUpper middle incomeUruguayUzbekistanVanuatuVenezuela, RBVietnamVirgin Islands (U.S.)West Bank and GazaWorldYemen, Rep.ZambiaZimbabwe Timeline:
This timeline shows a graph from 1961 to 2016 of Heavily indebted poor countries (HIPC). No data until 1960. Number of actual observations by date: 56.
Source name:
World Development Indicators
Source organization:
World Bank Staff estimates based on United Nations, World Urbanization Prospects.
Categories, topics:
Agriculture & Rural Development
Last updated:
apr 23, 2017
Indicators value changes by year
Minimum:
65.414
jan 1, 2016
Maximum:
87.764
jan 1, 1961
At the date of observation
Value
Absolute change
Change from previous value
jan 1, 1961
87.764
+87.764
0.0%
jan 1, 1962
87.417
-0.347
-0.4%
jan 1, 1963
87.058
-0.359
-0.41%
jan 1, 1964
86.684
-0.374
-0.43%
jan 1, 1965
86.286
-0.398
-0.46%
jan 1, 1966
85.876
-0.41
-0.48%
jan 1, 1967
85.474
-0.403
-0.47%
jan 1, 1968
85.058
-0.415
-0.49%
jan 1, 1969
84.63
-0.428
-0.5%
jan 1, 1970
84.186
-0.444
-0.52%
jan 1, 1971
83.758
-0.429
-0.51%
jan 1, 1972
83.316
-0.441
-0.53%
jan 1, 1973
82.87
-0.447
-0.54%
jan 1, 1974
82.418
-0.452
-0.55%
jan 1, 1975
81.969
-0.449
-0.54%
jan 1, 1976
81.503
-0.465
-0.57%
jan 1, 1977
81.018
-0.485
-0.6%
jan 1, 1978
80.531
-0.487
-0.6%
jan 1, 1979
80.033
-0.497
-0.62%
jan 1, 1980
79.616
-0.417
-0.52%
jan 1, 1981
79.214
-0.402
-0.5%
jan 1, 1982
78.823
-0.391
-0.49%
jan 1, 1983
78.428
-0.394
-0.5%
jan 1, 1984
78.003
-0.425
-0.54%
jan 1, 1985
77.544
-0.459
-0.59%
jan 1, 1986
77.053
-0.492
-0.63%
jan 1, 1987
76.573
-0.48
-0.62%
jan 1, 1988
76.107
-0.466
-0.61%
jan 1, 1989
75.648
-0.459
-0.6%
jan 1, 1990
75.201
-0.447
-0.59%
jan 1, 1991
74.741
-0.46
-0.61%
jan 1, 1992
74.316
-0.425
-0.57%
jan 1, 1993
73.907
-0.408
-0.55%
jan 1, 1994
73.525
-0.382
-0.52%
jan 1, 1995
73.212
-0.314
-0.43%
jan 1, 1996
72.913
-0.298
-0.41%
jan 1, 1997
72.626
-0.287
-0.39%
jan 1, 1998
72.329
-0.297
-0.41%
jan 1, 1999
72.045
-0.283
-0.39%
jan 1, 2000
71.758
-0.287
-0.4%
jan 1, 2001
71.467
-0.292
-0.41%
jan 1, 2002
71.145
-0.322
-0.45%
jan 1, 2003
70.813
-0.332
-0.47%
jan 1, 2004
70.46
-0.353
-0.5%
jan 1, 2005
70.099
-0.362
-0.51%
jan 1, 2006
69.721
-0.378
-0.54%
jan 1, 2007
69.336
-0.385
-0.55%
jan 1, 2008
68.939
-0.397
-0.57%
jan 1, 2009
68.513
-0.426
-0.62%
jan 1, 2010
68.082
-0.431
-0.63%
jan 1, 2011
67.647
-0.435
-0.64%
jan 1, 2012
67.208
-0.439
-0.65%
jan 1, 2013
66.765
-0.443
-0.66%
jan 1, 2014
66.319
-0.446
-0.67%
jan 1, 2015
65.869
-0.45
-0.68%
jan 1, 2016
65.414
-0.455
-0.69%
Ranking of countries by current statistics by years


Comments: