29
/
en
AIzaSyAYiBZKx7MnpbEhh9jyipgxe19OcubqV5w
April 1, 2024
45643
Low & middle income
LMY
false
2
1
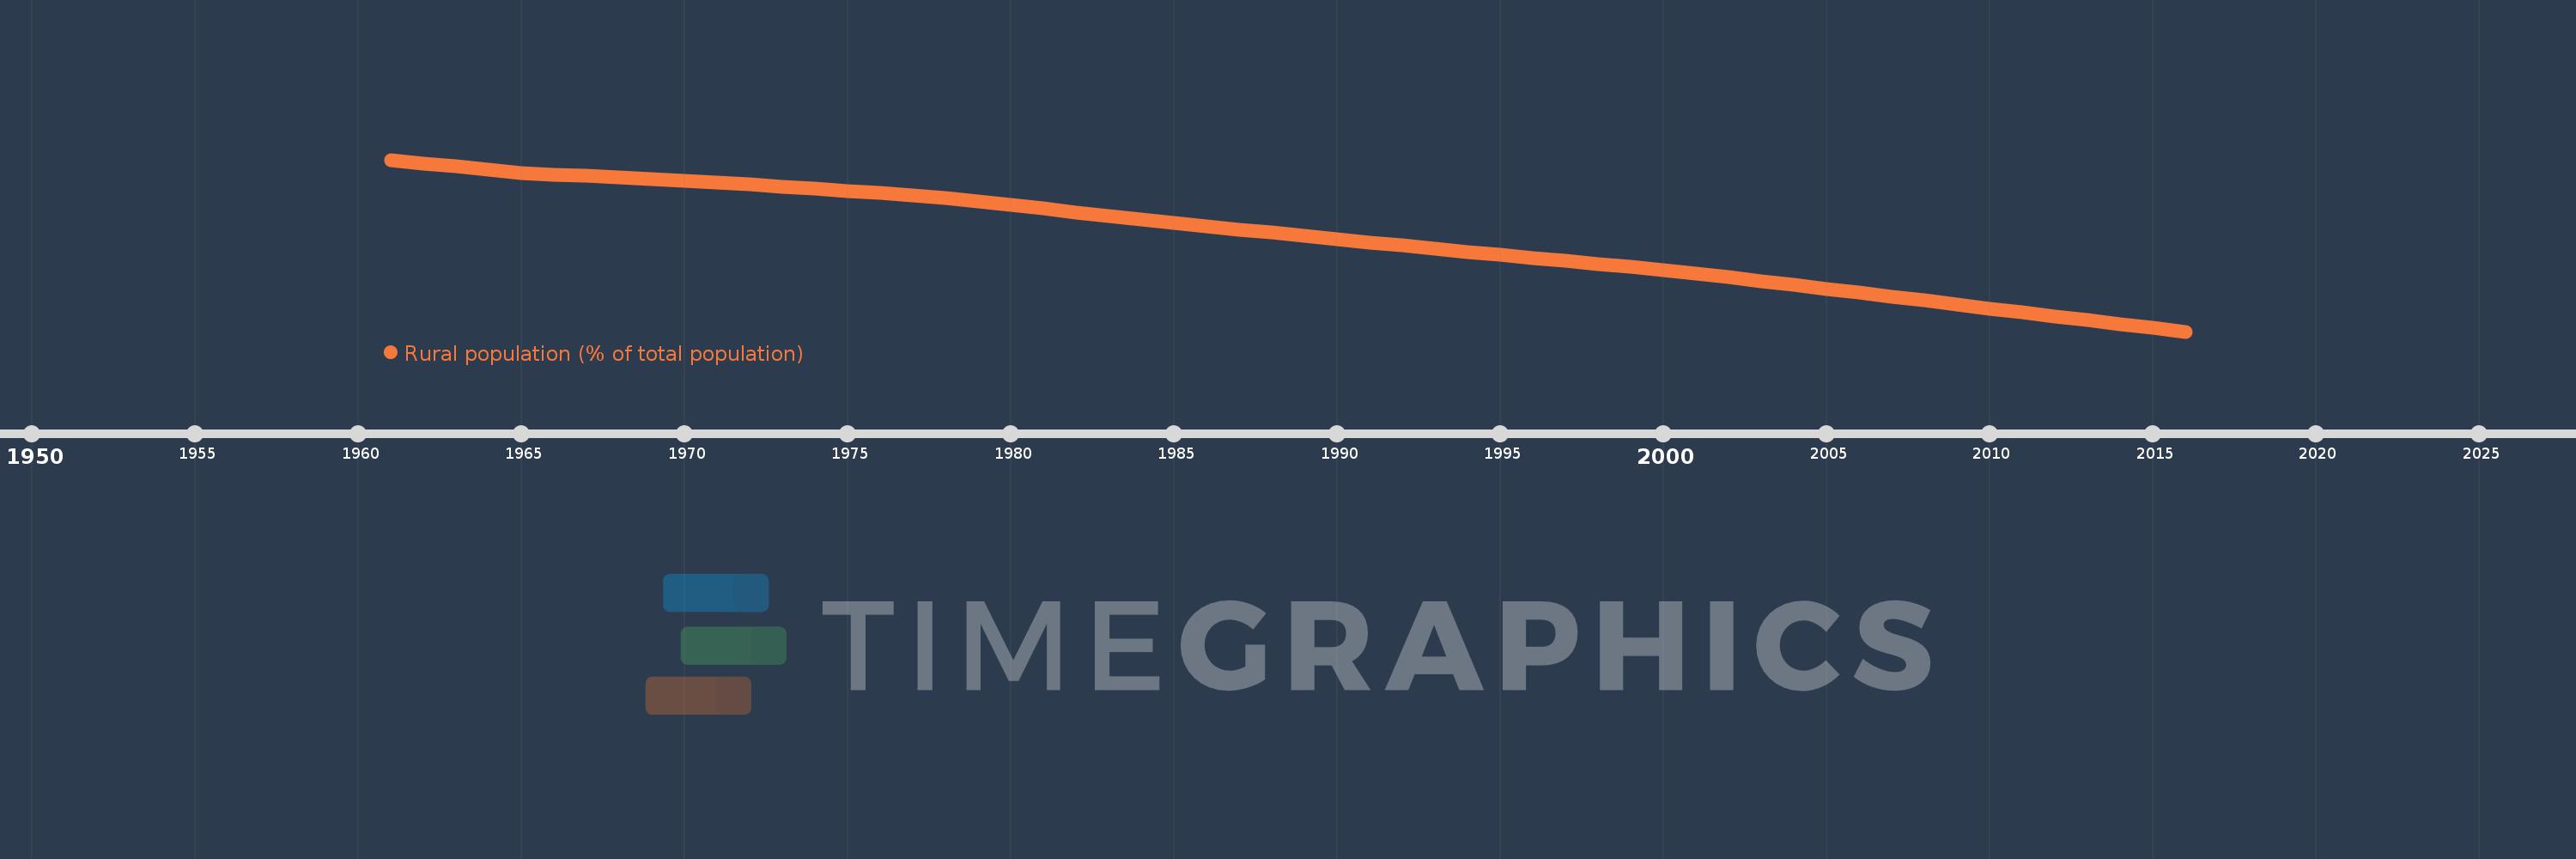
Rural population (% of total population)
2016,2015,2014,2013,2012,2011,2010,2009,2008,2007,2006,2005,2004,2003,2002,2001,2000,1999,1998,1997,1996,1995,1994,1993,1992,1991,1990,1989,1988,1987,1986,1985,1984,1983,1982,1981,1980,1979,1978,1977,1976,1975,1974,1973,1972,1971,1970,1969,1968,1967,1966,1965,1964,1963,1962,1961
This statistics in other country:
AfghanistanAlbaniaAlgeriaAmerican SamoaAndorraAngolaAntigua and BarbudaArab WorldArgentinaArmeniaArubaAustraliaAustriaAzerbaijanBahamas, TheBahrainBangladeshBarbadosBelarusBelgiumBelizeBeninBermudaBhutanBoliviaBosnia and HerzegovinaBotswanaBrazilBritish Virgin IslandsBrunei DarussalamBulgariaBurkina FasoBurundiCabo VerdeCambodiaCameroonCanadaCaribbean small statesCayman IslandsCentral African RepublicCentral Europe and the BalticsChadChannel IslandsChileChinaColombiaComorosCongo, Dem. Rep.Congo, Rep.Costa RicaCote d'IvoireCroatiaCubaCuracaoCyprusCzech RepublicDenmarkDjiboutiDominicaDominican RepublicEarly-demographic dividendEast Asia & PacificEast Asia & Pacific (excluding high income)East Asia & Pacific (IDA & IBRD countries)EcuadorEgypt, Arab Rep.El SalvadorEquatorial GuineaEritreaEstoniaEthiopiaEuro areaEurope & Central AsiaEurope & Central Asia (excluding high income)Europe & Central Asia (IDA & IBRD countries)European UnionFaroe IslandsFijiFinlandFragile and conflict affected situationsFranceFrench PolynesiaGabonGambia, TheGeorgiaGermanyGhanaGibraltarGreeceGreenlandGrenadaGuamGuatemalaGuineaGuinea-BissauGuyanaHaitiHeavily indebted poor countries (HIPC)High incomeHondurasHong Kong SAR, ChinaHungaryIBRD onlyIcelandIDA & IBRD totalIDA blendIDA onlyIDA totalIndiaIndonesiaIran, Islamic Rep.IraqIrelandIsle of ManIsraelItalyJamaicaJapanJordanKazakhstanKenyaKiribatiKorea, Dem. People’s Rep.Korea, Rep.KuwaitKyrgyz RepublicLao PDRLate-demographic dividendLatin America & Caribbean Latin America & Caribbean (excluding high income)Latin America & the Caribbean (IDA & IBRD countries)LatviaLeast developed countries: UN classificationLebanonLesothoLiberiaLibyaLiechtensteinLithuaniaLow & middle incomeLow incomeLower middle incomeLuxembourgMacao SAR, ChinaMacedonia, FYRMadagascarMalawiMalaysiaMaldivesMaliMaltaMarshall IslandsMauritaniaMauritiusMexicoMicronesia, Fed. Sts.Middle East & North AfricaMiddle East & North Africa (excluding high income)Middle East & North Africa (IDA & IBRD countries)Middle incomeMoldovaMonacoMongoliaMontenegroMoroccoMozambiqueMyanmarNamibiaNauruNepalNetherlandsNew CaledoniaNew ZealandNicaraguaNigerNigeriaNorth AmericaNorthern Mariana IslandsNorwayOECD membersOmanOther small statesPacific island small statesPakistanPalauPanamaPapua New GuineaParaguayPeruPhilippinesPolandPortugalPost-demographic dividendPre-demographic dividendPuerto RicoQatarRomaniaRussian FederationRwandaSamoaSan MarinoSao Tome and PrincipeSaudi ArabiaSenegalSerbiaSeychellesSierra LeoneSingaporeSint Maarten (Dutch part)Slovak RepublicSloveniaSmall statesSolomon IslandsSomaliaSouth AfricaSouth AsiaSouth Asia (IDA & IBRD)South SudanSpainSri LankaSt. Kitts and NevisSt. LuciaSt. Vincent and the GrenadinesSub-Saharan Africa Sub-Saharan Africa (excluding high income)Sub-Saharan Africa (IDA & IBRD countries)SudanSurinameSwazilandSwedenSwitzerlandSyrian Arab RepublicTajikistanTanzaniaThailandTimor-LesteTogoTongaTrinidad and TobagoTunisiaTurkeyTurkmenistanTurks and Caicos IslandsTuvaluUgandaUkraineUnited Arab EmiratesUnited KingdomUnited StatesUpper middle incomeUruguayUzbekistanVanuatuVenezuela, RBVietnamVirgin Islands (U.S.)West Bank and GazaWorldYemen, Rep.ZambiaZimbabwe Timeline:
This timeline shows a graph from 1961 to 2016 of Low & middle income. No data until 1960. Number of actual observations by date: 56.
Source name:
World Development Indicators
Source organization:
World Bank Staff estimates based on United Nations, World Urbanization Prospects.
Categories, topics:
Agriculture & Rural Development
Last updated:
apr 23, 2017
Indicators value changes by year
Minimum:
51.294
jan 1, 2016
Maximum:
76.397
jan 1, 1961
At the date of observation
Value
Absolute change
Change from previous value
jan 1, 1961
76.397
+76.397
0.0%
jan 1, 1962
75.892
-0.505
-0.66%
jan 1, 1963
75.41
-0.482
-0.64%
jan 1, 1964
74.957
-0.453
-0.6%
jan 1, 1965
74.497
-0.46
-0.61%
jan 1, 1966
74.256
-0.241
-0.32%
jan 1, 1967
74.025
-0.231
-0.31%
jan 1, 1968
73.782
-0.244
-0.33%
jan 1, 1969
73.534
-0.248
-0.34%
jan 1, 1970
73.287
-0.247
-0.34%
jan 1, 1971
73.041
-0.245
-0.33%
jan 1, 1972
72.788
-0.254
-0.35%
jan 1, 1973
72.501
-0.287
-0.39%
jan 1, 1974
72.18
-0.322
-0.44%
jan 1, 1975
71.821
-0.359
-0.5%
jan 1, 1976
71.516
-0.304
-0.42%
jan 1, 1977
71.161
-0.356
-0.5%
jan 1, 1978
70.801
-0.359
-0.5%
jan 1, 1979
70.348
-0.454
-0.64%
jan 1, 1980
69.811
-0.537
-0.76%
jan 1, 1981
69.267
-0.544
-0.78%
jan 1, 1982
68.713
-0.554
-0.8%
jan 1, 1983
68.193
-0.52
-0.76%
jan 1, 1984
67.71
-0.483
-0.71%
jan 1, 1985
67.213
-0.497
-0.73%
jan 1, 1986
66.714
-0.499
-0.74%
jan 1, 1987
66.22
-0.494
-0.74%
jan 1, 1988
65.733
-0.487
-0.74%
jan 1, 1989
65.248
-0.485
-0.74%
jan 1, 1990
64.777
-0.471
-0.72%
jan 1, 1991
64.304
-0.472
-0.73%
jan 1, 1992
63.85
-0.455
-0.71%
jan 1, 1993
63.4
-0.449
-0.7%
jan 1, 1994
62.953
-0.447
-0.71%
jan 1, 1995
62.509
-0.444
-0.7%
jan 1, 1996
62.065
-0.444
-0.71%
jan 1, 1997
61.62
-0.446
-0.72%
jan 1, 1998
61.167
-0.453
-0.73%
jan 1, 1999
60.709
-0.458
-0.75%
jan 1, 2000
60.247
-0.462
-0.76%
jan 1, 2001
59.777
-0.47
-0.78%
jan 1, 2002
59.26
-0.517
-0.86%
jan 1, 2003
58.697
-0.563
-0.95%
jan 1, 2004
58.126
-0.571
-0.97%
jan 1, 2005
57.55
-0.577
-0.99%
jan 1, 2006
56.969
-0.581
-1.01%
jan 1, 2007
56.395
-0.574
-1.01%
jan 1, 2008
55.825
-0.57
-1.01%
jan 1, 2009
55.249
-0.576
-1.03%
jan 1, 2010
54.673
-0.576
-1.04%
jan 1, 2011
54.097
-0.577
-1.05%
jan 1, 2012
53.521
-0.576
-1.06%
jan 1, 2013
52.95
-0.571
-1.07%
jan 1, 2014
52.388
-0.562
-1.06%
jan 1, 2015
51.836
-0.552
-1.05%
jan 1, 2016
51.294
-0.542
-1.05%
Ranking of countries by current statistics by years


Comments: