29
/
en
AIzaSyAYiBZKx7MnpbEhh9jyipgxe19OcubqV5w
April 1, 2024
155297
India
IND
true
2
1
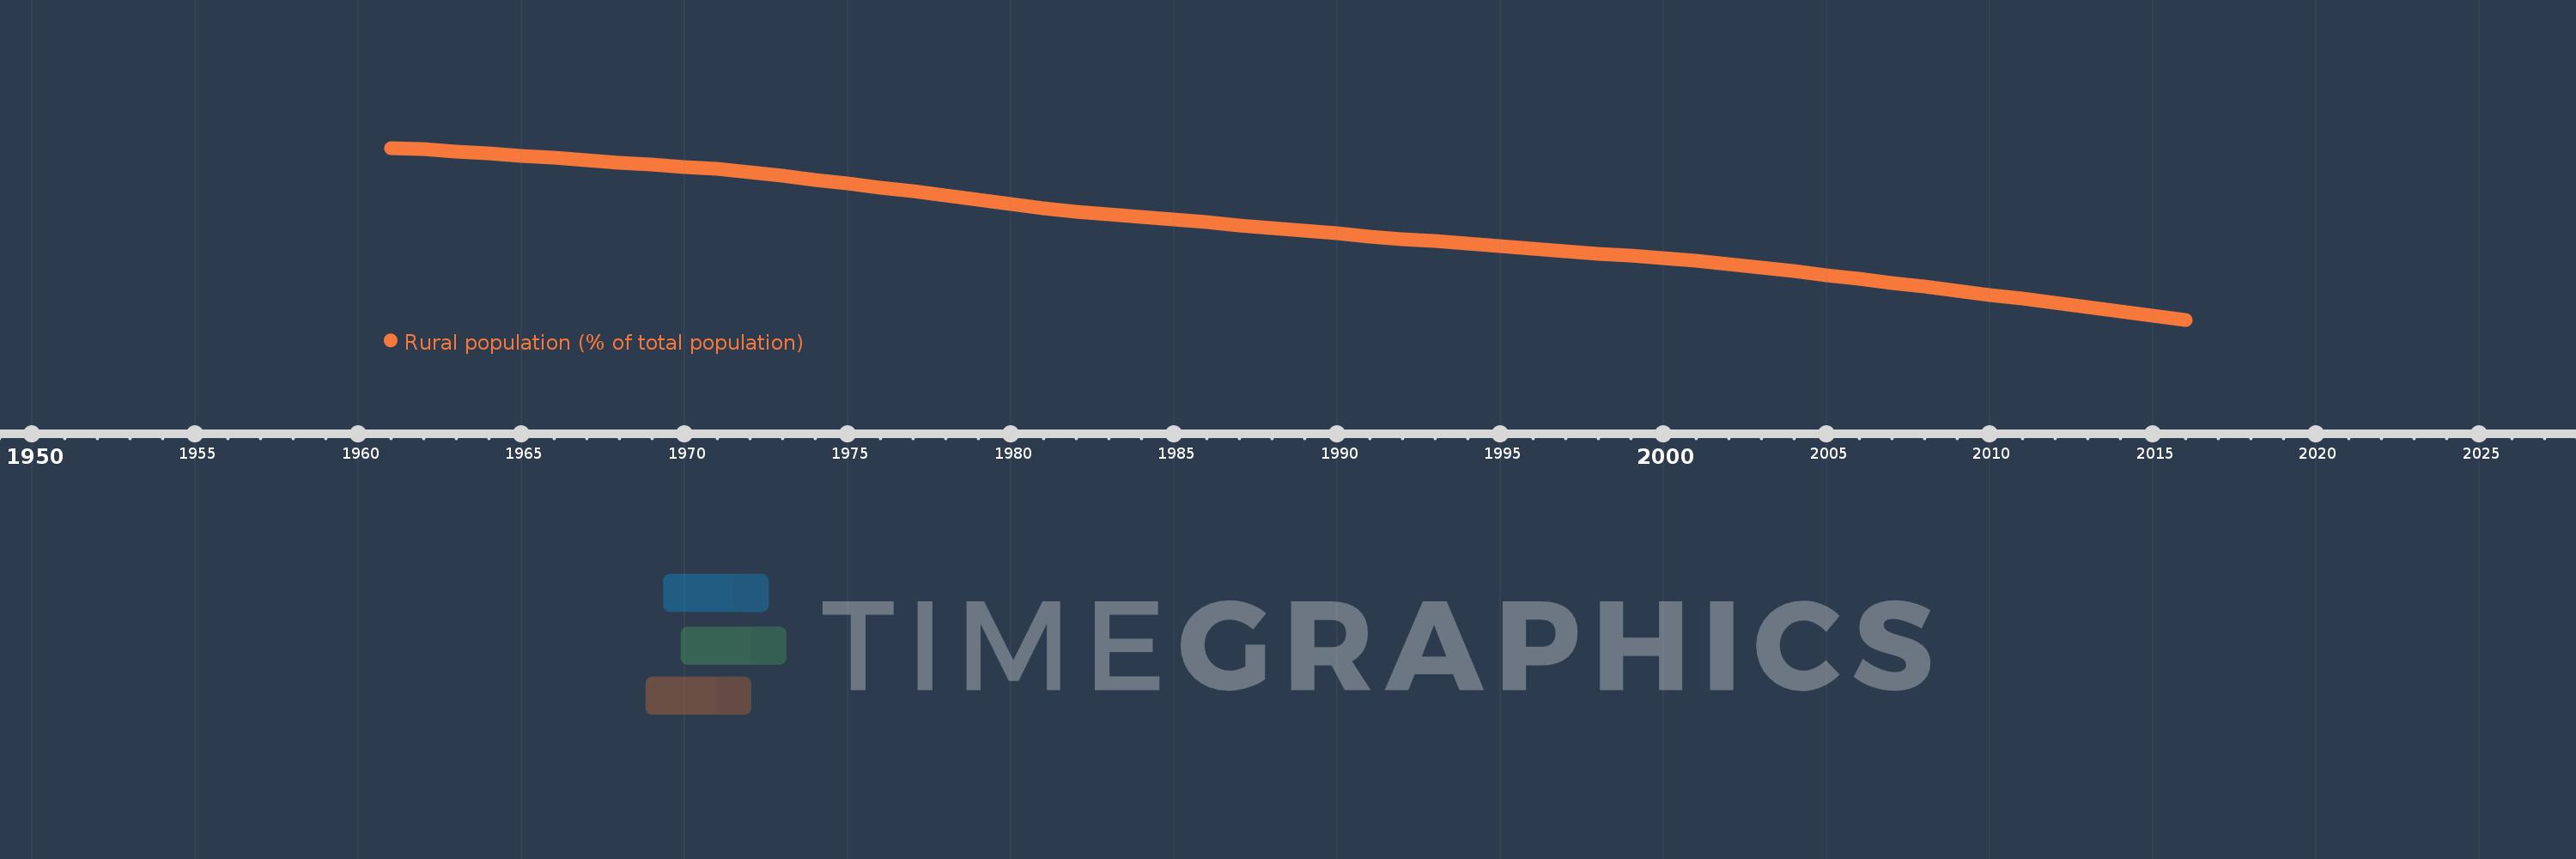
Rural population (% of total population)
2016,2015,2014,2013,2012,2011,2010,2009,2008,2007,2006,2005,2004,2003,2002,2001,2000,1999,1998,1997,1996,1995,1994,1993,1992,1991,1990,1989,1988,1987,1986,1985,1984,1983,1982,1981,1980,1979,1978,1977,1976,1975,1974,1973,1972,1971,1970,1969,1968,1967,1966,1965,1964,1963,1962,1961
This statistics in other country:
AfghanistanAlbaniaAlgeriaAmerican SamoaAndorraAngolaAntigua and BarbudaArab WorldArgentinaArmeniaArubaAustraliaAustriaAzerbaijanBahamas, TheBahrainBangladeshBarbadosBelarusBelgiumBelizeBeninBermudaBhutanBoliviaBosnia and HerzegovinaBotswanaBrazilBritish Virgin IslandsBrunei DarussalamBulgariaBurkina FasoBurundiCabo VerdeCambodiaCameroonCanadaCaribbean small statesCayman IslandsCentral African RepublicCentral Europe and the BalticsChadChannel IslandsChileChinaColombiaComorosCongo, Dem. Rep.Congo, Rep.Costa RicaCote d'IvoireCroatiaCubaCuracaoCyprusCzech RepublicDenmarkDjiboutiDominicaDominican RepublicEarly-demographic dividendEast Asia & PacificEast Asia & Pacific (excluding high income)East Asia & Pacific (IDA & IBRD countries)EcuadorEgypt, Arab Rep.El SalvadorEquatorial GuineaEritreaEstoniaEthiopiaEuro areaEurope & Central AsiaEurope & Central Asia (excluding high income)Europe & Central Asia (IDA & IBRD countries)European UnionFaroe IslandsFijiFinlandFragile and conflict affected situationsFranceFrench PolynesiaGabonGambia, TheGeorgiaGermanyGhanaGibraltarGreeceGreenlandGrenadaGuamGuatemalaGuineaGuinea-BissauGuyanaHaitiHeavily indebted poor countries (HIPC)High incomeHondurasHong Kong SAR, ChinaHungaryIBRD onlyIcelandIDA & IBRD totalIDA blendIDA onlyIDA totalIndiaIndonesiaIran, Islamic Rep.IraqIrelandIsle of ManIsraelItalyJamaicaJapanJordanKazakhstanKenyaKiribatiKorea, Dem. People’s Rep.Korea, Rep.KuwaitKyrgyz RepublicLao PDRLate-demographic dividendLatin America & Caribbean Latin America & Caribbean (excluding high income)Latin America & the Caribbean (IDA & IBRD countries)LatviaLeast developed countries: UN classificationLebanonLesothoLiberiaLibyaLiechtensteinLithuaniaLow & middle incomeLow incomeLower middle incomeLuxembourgMacao SAR, ChinaMacedonia, FYRMadagascarMalawiMalaysiaMaldivesMaliMaltaMarshall IslandsMauritaniaMauritiusMexicoMicronesia, Fed. Sts.Middle East & North AfricaMiddle East & North Africa (excluding high income)Middle East & North Africa (IDA & IBRD countries)Middle incomeMoldovaMonacoMongoliaMontenegroMoroccoMozambiqueMyanmarNamibiaNauruNepalNetherlandsNew CaledoniaNew ZealandNicaraguaNigerNigeriaNorth AmericaNorthern Mariana IslandsNorwayOECD membersOmanOther small statesPacific island small statesPakistanPalauPanamaPapua New GuineaParaguayPeruPhilippinesPolandPortugalPost-demographic dividendPre-demographic dividendPuerto RicoQatarRomaniaRussian FederationRwandaSamoaSan MarinoSao Tome and PrincipeSaudi ArabiaSenegalSerbiaSeychellesSierra LeoneSingaporeSint Maarten (Dutch part)Slovak RepublicSloveniaSmall statesSolomon IslandsSomaliaSouth AfricaSouth AsiaSouth Asia (IDA & IBRD)South SudanSpainSri LankaSt. Kitts and NevisSt. LuciaSt. Vincent and the GrenadinesSub-Saharan Africa Sub-Saharan Africa (excluding high income)Sub-Saharan Africa (IDA & IBRD countries)SudanSurinameSwazilandSwedenSwitzerlandSyrian Arab RepublicTajikistanTanzaniaThailandTimor-LesteTogoTongaTrinidad and TobagoTunisiaTurkeyTurkmenistanTurks and Caicos IslandsTuvaluUgandaUkraineUnited Arab EmiratesUnited KingdomUnited StatesUpper middle incomeUruguayUzbekistanVanuatuVenezuela, RBVietnamVirgin Islands (U.S.)West Bank and GazaWorldYemen, Rep.ZambiaZimbabwe Timeline:
This timeline shows a graph from 1961 to 2016 of India. No data until 1960. Number of actual observations by date: 56.
Source name:
World Development Indicators
Source organization:
World Bank Staff estimates based on United Nations, World Urbanization Prospects.
Categories, topics:
Agriculture & Rural Development
Last updated:
apr 23, 2017
Indicators value changes by year
Minimum:
67.253
jan 1, 2016
Maximum:
82.076
jan 1, 1961
At the date of observation
Value
Absolute change
Change from previous value
jan 1, 1961
82.076
+82.076
0.0%
jan 1, 1962
81.968
-0.108
-0.13%
jan 1, 1963
81.782
-0.186
-0.23%
jan 1, 1964
81.595
-0.187
-0.23%
jan 1, 1965
81.405
-0.19
-0.23%
jan 1, 1966
81.215
-0.19
-0.23%
jan 1, 1967
81.023
-0.192
-0.24%
jan 1, 1968
80.829
-0.194
-0.24%
jan 1, 1969
80.634
-0.195
-0.24%
jan 1, 1970
80.438
-0.196
-0.24%
jan 1, 1971
80.24
-0.198
-0.25%
jan 1, 1972
80.009
-0.231
-0.29%
jan 1, 1973
79.679
-0.33
-0.41%
jan 1, 1974
79.347
-0.332
-0.42%
jan 1, 1975
79.009
-0.338
-0.43%
jan 1, 1976
78.668
-0.341
-0.43%
jan 1, 1977
78.323
-0.345
-0.44%
jan 1, 1978
77.974
-0.349
-0.45%
jan 1, 1979
77.621
-0.353
-0.45%
jan 1, 1980
77.264
-0.357
-0.46%
jan 1, 1981
76.902
-0.362
-0.47%
jan 1, 1982
76.583
-0.319
-0.41%
jan 1, 1983
76.353
-0.23
-0.3%
jan 1, 1984
76.121
-0.232
-0.3%
jan 1, 1985
75.887
-0.234
-0.31%
jan 1, 1986
75.652
-0.235
-0.31%
jan 1, 1987
75.415
-0.237
-0.31%
jan 1, 1988
75.177
-0.238
-0.32%
jan 1, 1989
74.937
-0.24
-0.32%
jan 1, 1990
74.695
-0.242
-0.32%
jan 1, 1991
74.453
-0.242
-0.32%
jan 1, 1992
74.222
-0.231
-0.31%
jan 1, 1993
74.016
-0.206
-0.28%
jan 1, 1994
73.809
-0.207
-0.28%
jan 1, 1995
73.601
-0.208
-0.28%
jan 1, 1996
73.393
-0.208
-0.28%
jan 1, 1997
73.183
-0.21
-0.29%
jan 1, 1998
72.972
-0.211
-0.29%
jan 1, 1999
72.76
-0.212
-0.29%
jan 1, 2000
72.547
-0.213
-0.29%
jan 1, 2001
72.333
-0.214
-0.29%
jan 1, 2002
72.082
-0.251
-0.35%
jan 1, 2003
71.756
-0.326
-0.45%
jan 1, 2004
71.428
-0.328
-0.46%
jan 1, 2005
71.097
-0.331
-0.46%
jan 1, 2006
70.765
-0.332
-0.47%
jan 1, 2007
70.431
-0.334
-0.47%
jan 1, 2008
70.094
-0.337
-0.48%
jan 1, 2009
69.754
-0.34
-0.49%
jan 1, 2010
69.413
-0.341
-0.49%
jan 1, 2011
69.07
-0.343
-0.49%
jan 1, 2012
68.724
-0.346
-0.5%
jan 1, 2013
68.369
-0.355
-0.52%
jan 1, 2014
68.006
-0.363
-0.53%
jan 1, 2015
67.634
-0.372
-0.55%
jan 1, 2016
67.253
-0.381
-0.56%
Ranking of countries by current statistics by years


Comments: