29
/
en
AIzaSyAYiBZKx7MnpbEhh9jyipgxe19OcubqV5w
April 1, 2024
30270
Euro area
EMU
false
2
1
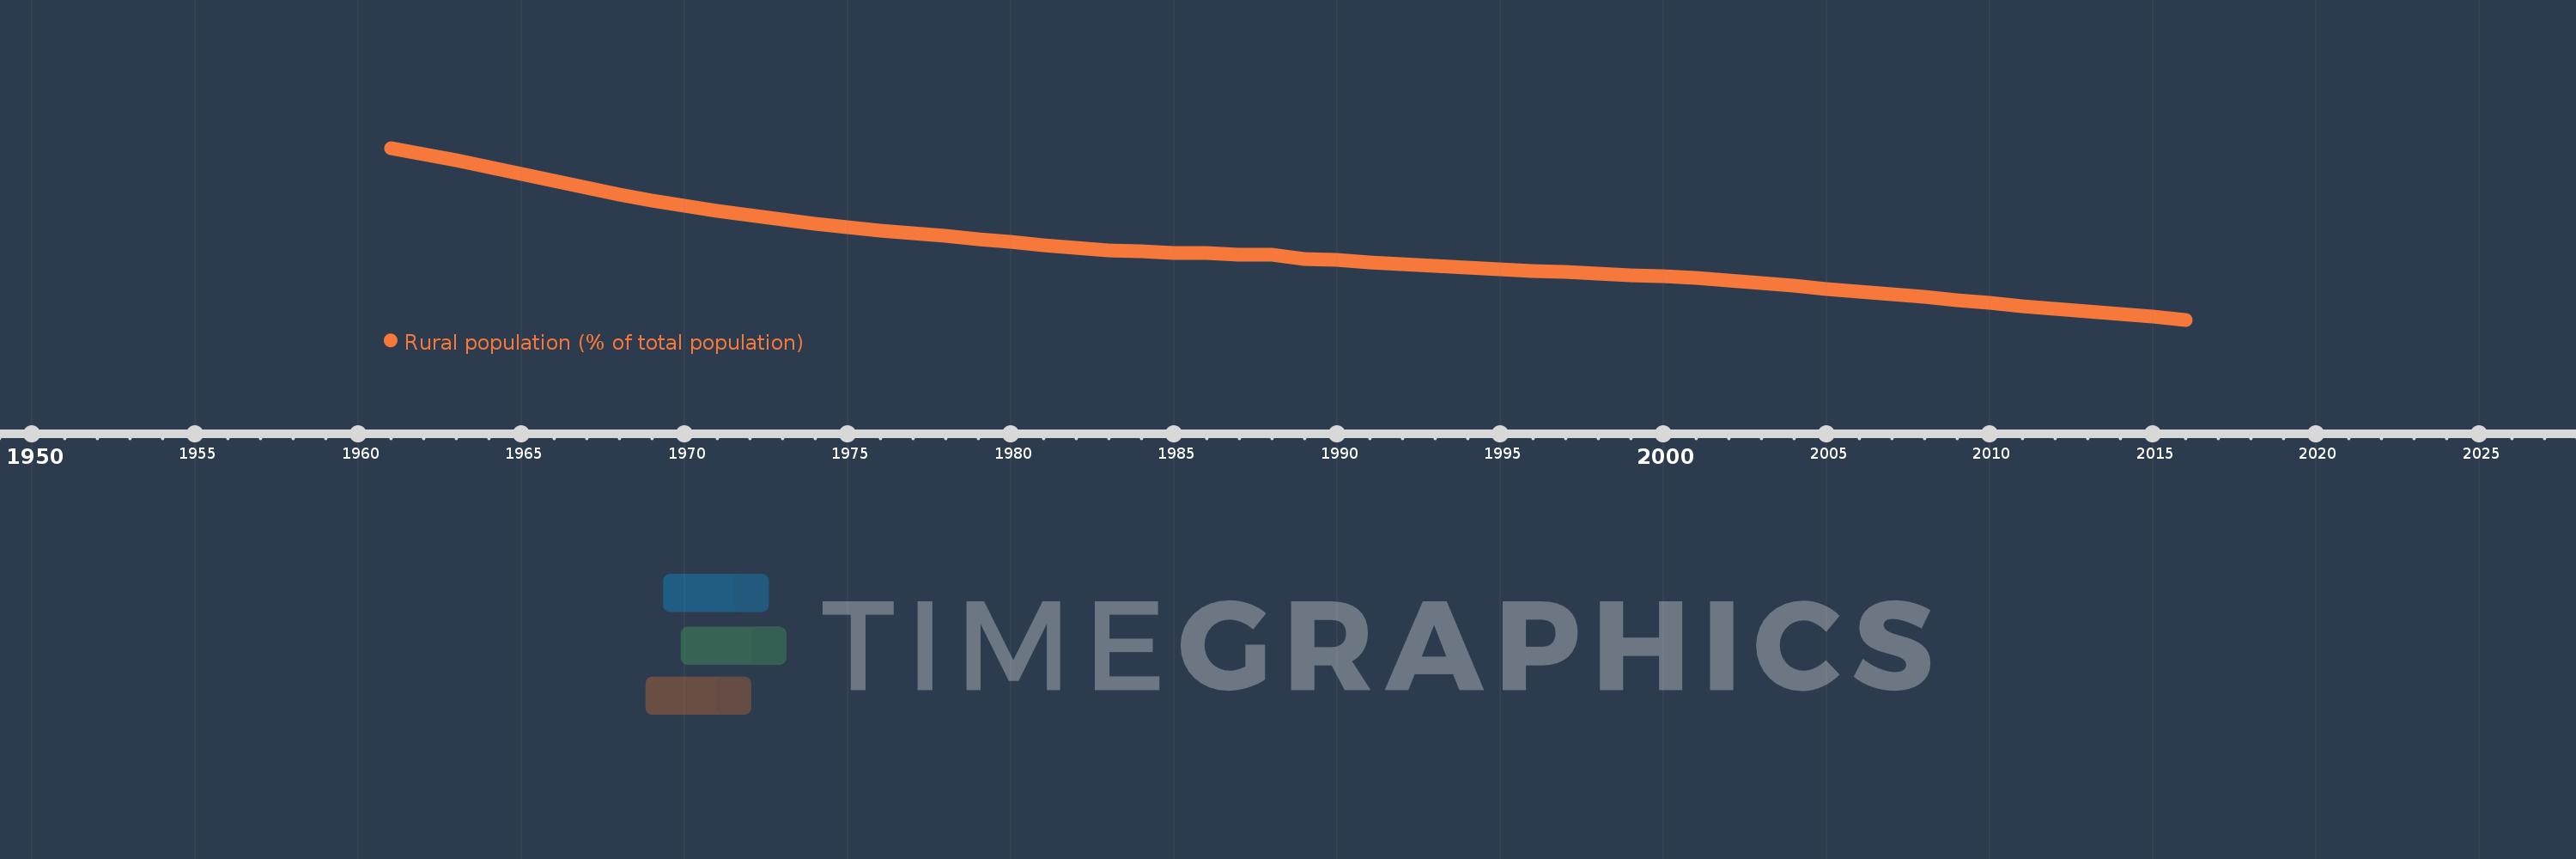
Rural population (% of total population)
2016,2015,2014,2013,2012,2011,2010,2009,2008,2007,2006,2005,2004,2003,2002,2001,2000,1999,1998,1997,1996,1995,1994,1993,1992,1991,1990,1989,1988,1987,1986,1985,1984,1983,1982,1981,1980,1979,1978,1977,1976,1975,1974,1973,1972,1971,1970,1969,1968,1967,1966,1965,1964,1963,1962,1961
This statistics in other country:
AfghanistanAlbaniaAlgeriaAmerican SamoaAndorraAngolaAntigua and BarbudaArab WorldArgentinaArmeniaArubaAustraliaAustriaAzerbaijanBahamas, TheBahrainBangladeshBarbadosBelarusBelgiumBelizeBeninBermudaBhutanBoliviaBosnia and HerzegovinaBotswanaBrazilBritish Virgin IslandsBrunei DarussalamBulgariaBurkina FasoBurundiCabo VerdeCambodiaCameroonCanadaCaribbean small statesCayman IslandsCentral African RepublicCentral Europe and the BalticsChadChannel IslandsChileChinaColombiaComorosCongo, Dem. Rep.Congo, Rep.Costa RicaCote d'IvoireCroatiaCubaCuracaoCyprusCzech RepublicDenmarkDjiboutiDominicaDominican RepublicEarly-demographic dividendEast Asia & PacificEast Asia & Pacific (excluding high income)East Asia & Pacific (IDA & IBRD countries)EcuadorEgypt, Arab Rep.El SalvadorEquatorial GuineaEritreaEstoniaEthiopiaEuro areaEurope & Central AsiaEurope & Central Asia (excluding high income)Europe & Central Asia (IDA & IBRD countries)European UnionFaroe IslandsFijiFinlandFragile and conflict affected situationsFranceFrench PolynesiaGabonGambia, TheGeorgiaGermanyGhanaGibraltarGreeceGreenlandGrenadaGuamGuatemalaGuineaGuinea-BissauGuyanaHaitiHeavily indebted poor countries (HIPC)High incomeHondurasHong Kong SAR, ChinaHungaryIBRD onlyIcelandIDA & IBRD totalIDA blendIDA onlyIDA totalIndiaIndonesiaIran, Islamic Rep.IraqIrelandIsle of ManIsraelItalyJamaicaJapanJordanKazakhstanKenyaKiribatiKorea, Dem. People’s Rep.Korea, Rep.KuwaitKyrgyz RepublicLao PDRLate-demographic dividendLatin America & Caribbean Latin America & Caribbean (excluding high income)Latin America & the Caribbean (IDA & IBRD countries)LatviaLeast developed countries: UN classificationLebanonLesothoLiberiaLibyaLiechtensteinLithuaniaLow & middle incomeLow incomeLower middle incomeLuxembourgMacao SAR, ChinaMacedonia, FYRMadagascarMalawiMalaysiaMaldivesMaliMaltaMarshall IslandsMauritaniaMauritiusMexicoMicronesia, Fed. Sts.Middle East & North AfricaMiddle East & North Africa (excluding high income)Middle East & North Africa (IDA & IBRD countries)Middle incomeMoldovaMonacoMongoliaMontenegroMoroccoMozambiqueMyanmarNamibiaNauruNepalNetherlandsNew CaledoniaNew ZealandNicaraguaNigerNigeriaNorth AmericaNorthern Mariana IslandsNorwayOECD membersOmanOther small statesPacific island small statesPakistanPalauPanamaPapua New GuineaParaguayPeruPhilippinesPolandPortugalPost-demographic dividendPre-demographic dividendPuerto RicoQatarRomaniaRussian FederationRwandaSamoaSan MarinoSao Tome and PrincipeSaudi ArabiaSenegalSerbiaSeychellesSierra LeoneSingaporeSint Maarten (Dutch part)Slovak RepublicSloveniaSmall statesSolomon IslandsSomaliaSouth AfricaSouth AsiaSouth Asia (IDA & IBRD)South SudanSpainSri LankaSt. Kitts and NevisSt. LuciaSt. Vincent and the GrenadinesSub-Saharan Africa Sub-Saharan Africa (excluding high income)Sub-Saharan Africa (IDA & IBRD countries)SudanSurinameSwazilandSwedenSwitzerlandSyrian Arab RepublicTajikistanTanzaniaThailandTimor-LesteTogoTongaTrinidad and TobagoTunisiaTurkeyTurkmenistanTurks and Caicos IslandsTuvaluUgandaUkraineUnited Arab EmiratesUnited KingdomUnited StatesUpper middle incomeUruguayUzbekistanVanuatuVenezuela, RBVietnamVirgin Islands (U.S.)West Bank and GazaWorldYemen, Rep.ZambiaZimbabwe Timeline:
This timeline shows a graph from 1961 to 2016 of Euro area. No data until 1960. Number of actual observations by date: 56.
Source name:
World Development Indicators
Source organization:
World Bank Staff estimates based on United Nations, World Urbanization Prospects.
Categories, topics:
Agriculture & Rural Development
Last updated:
apr 23, 2017
Indicators value changes by year
Minimum:
24.075
jan 1, 2016
Maximum:
37.903
jan 1, 1961
At the date of observation
Value
Absolute change
Change from previous value
jan 1, 1961
37.903
+37.903
0.0%
jan 1, 1962
37.425
-0.478
-1.26%
jan 1, 1963
36.931
-0.493
-1.32%
jan 1, 1964
36.37
-0.561
-1.52%
jan 1, 1965
35.811
-0.56
-1.54%
jan 1, 1966
35.253
-0.558
-1.56%
jan 1, 1967
34.699
-0.553
-1.57%
jan 1, 1968
34.161
-0.538
-1.55%
jan 1, 1969
33.671
-0.49
-1.44%
jan 1, 1970
33.257
-0.414
-1.23%
jan 1, 1971
32.853
-0.404
-1.22%
jan 1, 1972
32.467
-0.386
-1.17%
jan 1, 1973
32.132
-0.335
-1.03%
jan 1, 1974
31.819
-0.313
-0.97%
jan 1, 1975
31.518
-0.301
-0.95%
jan 1, 1976
31.265
-0.254
-0.8%
jan 1, 1977
31.043
-0.222
-0.71%
jan 1, 1978
30.8
-0.242
-0.78%
jan 1, 1979
30.556
-0.244
-0.79%
jan 1, 1980
30.314
-0.242
-0.79%
jan 1, 1981
30.075
-0.239
-0.79%
jan 1, 1982
29.836
-0.24
-0.8%
jan 1, 1983
29.673
-0.163
-0.55%
jan 1, 1984
29.556
-0.117
-0.39%
jan 1, 1985
29.48
-0.076
-0.26%
jan 1, 1986
29.42
-0.06
-0.21%
jan 1, 1987
29.323
-0.097
-0.33%
jan 1, 1988
29.306
-0.017
-0.06%
jan 1, 1989
28.98
-0.327
-1.11%
jan 1, 1990
28.864
-0.115
-0.4%
jan 1, 1991
28.709
-0.155
-0.54%
jan 1, 1992
28.541
-0.168
-0.59%
jan 1, 1993
28.385
-0.155
-0.54%
jan 1, 1994
28.245
-0.141
-0.5%
jan 1, 1995
28.121
-0.124
-0.44%
jan 1, 1996
28.007
-0.114
-0.41%
jan 1, 1997
27.893
-0.114
-0.41%
jan 1, 1998
27.783
-0.11
-0.39%
jan 1, 1999
27.675
-0.108
-0.39%
jan 1, 2000
27.554
-0.121
-0.44%
jan 1, 2001
27.408
-0.146
-0.53%
jan 1, 2002
27.233
-0.176
-0.64%
jan 1, 2003
27.016
-0.216
-0.79%
jan 1, 2004
26.794
-0.222
-0.82%
jan 1, 2005
26.577
-0.217
-0.81%
jan 1, 2006
26.359
-0.218
-0.82%
jan 1, 2007
26.126
-0.232
-0.88%
jan 1, 2008
25.887
-0.24
-0.92%
jan 1, 2009
25.65
-0.237
-0.92%
jan 1, 2010
25.415
-0.234
-0.91%
jan 1, 2011
25.183
-0.233
-0.92%
jan 1, 2012
24.948
-0.235
-0.93%
jan 1, 2013
24.72
-0.227
-0.91%
jan 1, 2014
24.513
-0.207
-0.84%
jan 1, 2015
24.297
-0.216
-0.88%
jan 1, 2016
24.075
-0.222
-0.91%
Ranking of countries by current statistics by years


Comments: