29
/
en
AIzaSyAYiBZKx7MnpbEhh9jyipgxe19OcubqV5w
April 1, 2024
270029
Turkey
TUR
true
2
1
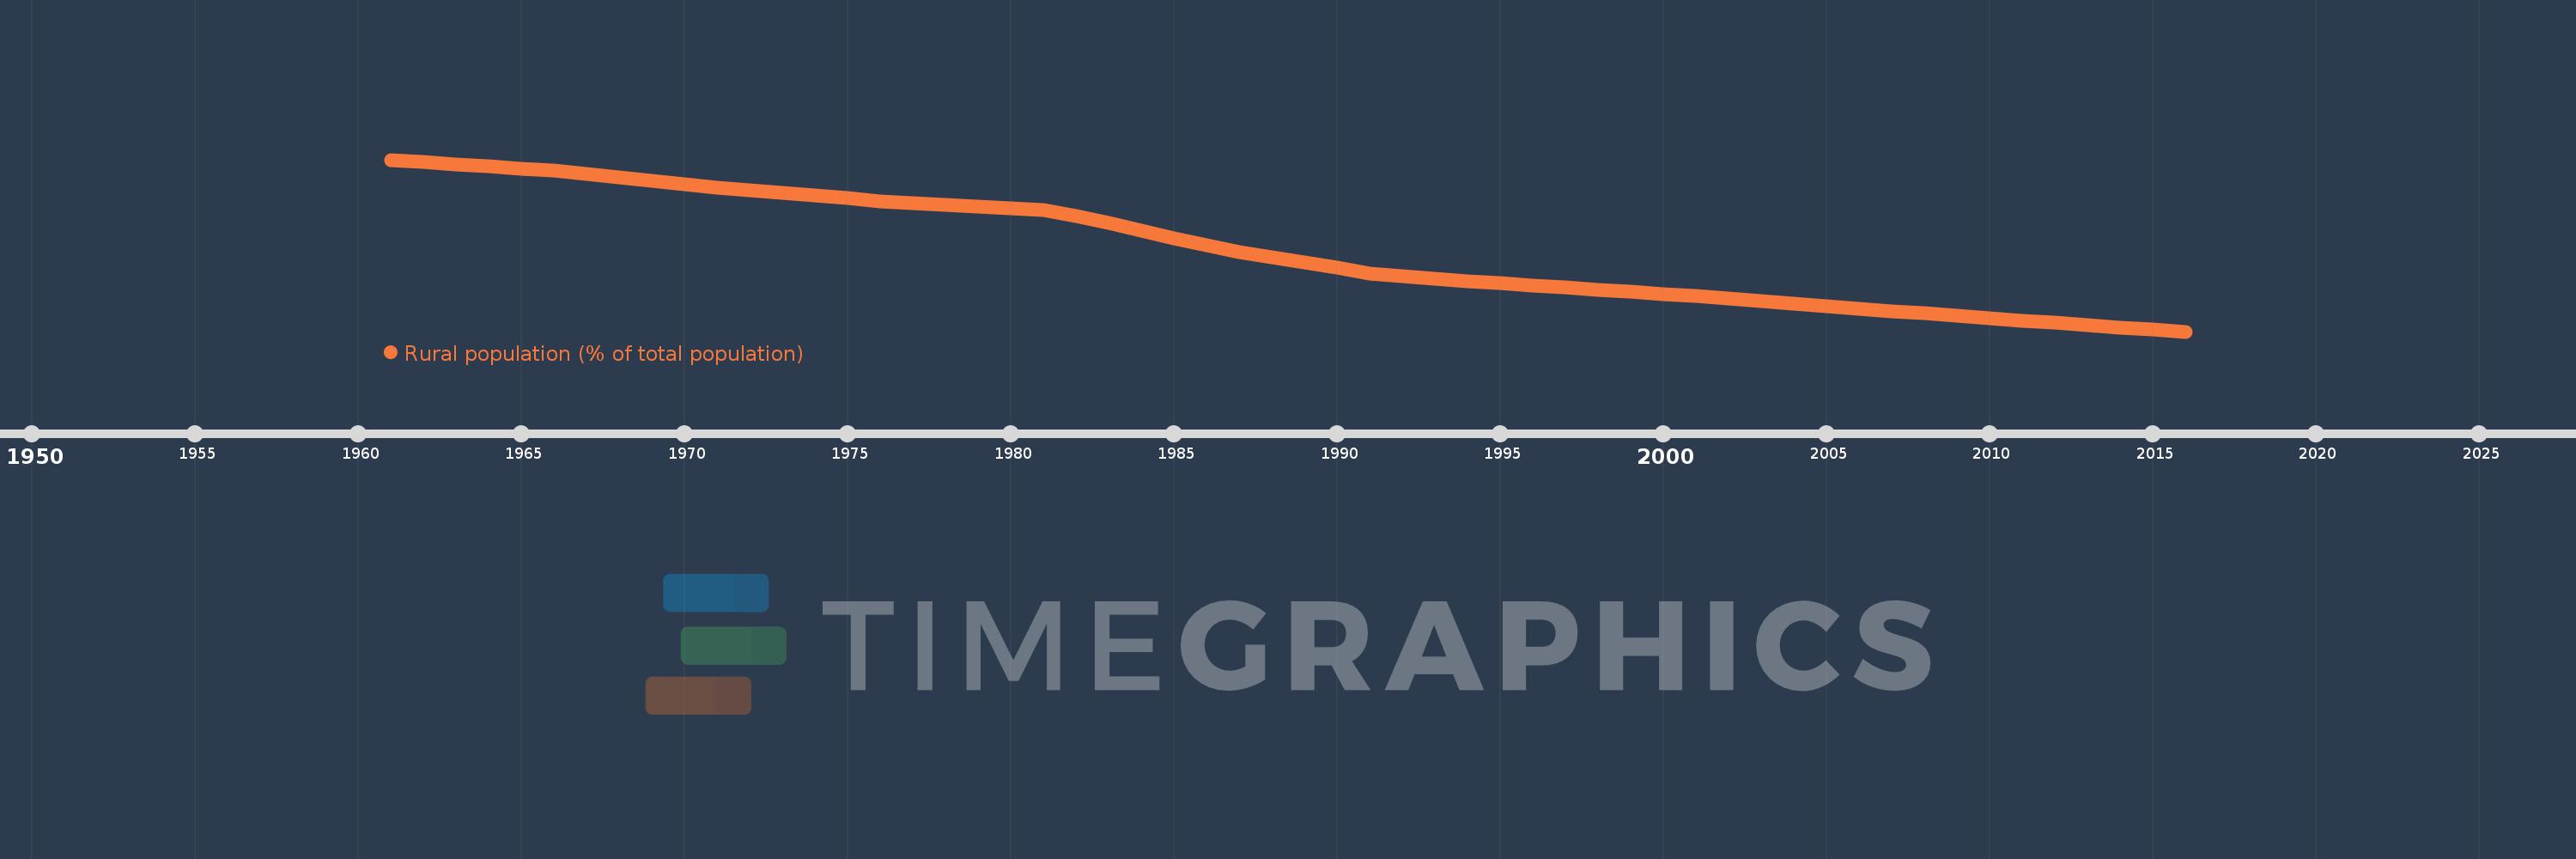
Rural population (% of total population)
2016,2015,2014,2013,2012,2011,2010,2009,2008,2007,2006,2005,2004,2003,2002,2001,2000,1999,1998,1997,1996,1995,1994,1993,1992,1991,1990,1989,1988,1987,1986,1985,1984,1983,1982,1981,1980,1979,1978,1977,1976,1975,1974,1973,1972,1971,1970,1969,1968,1967,1966,1965,1964,1963,1962,1961
This statistics in other country:
AfghanistanAlbaniaAlgeriaAmerican SamoaAndorraAngolaAntigua and BarbudaArab WorldArgentinaArmeniaArubaAustraliaAustriaAzerbaijanBahamas, TheBahrainBangladeshBarbadosBelarusBelgiumBelizeBeninBermudaBhutanBoliviaBosnia and HerzegovinaBotswanaBrazilBritish Virgin IslandsBrunei DarussalamBulgariaBurkina FasoBurundiCabo VerdeCambodiaCameroonCanadaCaribbean small statesCayman IslandsCentral African RepublicCentral Europe and the BalticsChadChannel IslandsChileChinaColombiaComorosCongo, Dem. Rep.Congo, Rep.Costa RicaCote d'IvoireCroatiaCubaCuracaoCyprusCzech RepublicDenmarkDjiboutiDominicaDominican RepublicEarly-demographic dividendEast Asia & PacificEast Asia & Pacific (excluding high income)East Asia & Pacific (IDA & IBRD countries)EcuadorEgypt, Arab Rep.El SalvadorEquatorial GuineaEritreaEstoniaEthiopiaEuro areaEurope & Central AsiaEurope & Central Asia (excluding high income)Europe & Central Asia (IDA & IBRD countries)European UnionFaroe IslandsFijiFinlandFragile and conflict affected situationsFranceFrench PolynesiaGabonGambia, TheGeorgiaGermanyGhanaGibraltarGreeceGreenlandGrenadaGuamGuatemalaGuineaGuinea-BissauGuyanaHaitiHeavily indebted poor countries (HIPC)High incomeHondurasHong Kong SAR, ChinaHungaryIBRD onlyIcelandIDA & IBRD totalIDA blendIDA onlyIDA totalIndiaIndonesiaIran, Islamic Rep.IraqIrelandIsle of ManIsraelItalyJamaicaJapanJordanKazakhstanKenyaKiribatiKorea, Dem. People’s Rep.Korea, Rep.KuwaitKyrgyz RepublicLao PDRLate-demographic dividendLatin America & Caribbean Latin America & Caribbean (excluding high income)Latin America & the Caribbean (IDA & IBRD countries)LatviaLeast developed countries: UN classificationLebanonLesothoLiberiaLibyaLiechtensteinLithuaniaLow & middle incomeLow incomeLower middle incomeLuxembourgMacao SAR, ChinaMacedonia, FYRMadagascarMalawiMalaysiaMaldivesMaliMaltaMarshall IslandsMauritaniaMauritiusMexicoMicronesia, Fed. Sts.Middle East & North AfricaMiddle East & North Africa (excluding high income)Middle East & North Africa (IDA & IBRD countries)Middle incomeMoldovaMonacoMongoliaMontenegroMoroccoMozambiqueMyanmarNamibiaNauruNepalNetherlandsNew CaledoniaNew ZealandNicaraguaNigerNigeriaNorth AmericaNorthern Mariana IslandsNorwayOECD membersOmanOther small statesPacific island small statesPakistanPalauPanamaPapua New GuineaParaguayPeruPhilippinesPolandPortugalPost-demographic dividendPre-demographic dividendPuerto RicoQatarRomaniaRussian FederationRwandaSamoaSan MarinoSao Tome and PrincipeSaudi ArabiaSenegalSerbiaSeychellesSierra LeoneSingaporeSint Maarten (Dutch part)Slovak RepublicSloveniaSmall statesSolomon IslandsSomaliaSouth AfricaSouth AsiaSouth Asia (IDA & IBRD)South SudanSpainSri LankaSt. Kitts and NevisSt. LuciaSt. Vincent and the GrenadinesSub-Saharan Africa Sub-Saharan Africa (excluding high income)Sub-Saharan Africa (IDA & IBRD countries)SudanSurinameSwazilandSwedenSwitzerlandSyrian Arab RepublicTajikistanTanzaniaThailandTimor-LesteTogoTongaTrinidad and TobagoTunisiaTurkeyTurkmenistanTurks and Caicos IslandsTuvaluUgandaUkraineUnited Arab EmiratesUnited KingdomUnited StatesUpper middle incomeUruguayUzbekistanVanuatuVenezuela, RBVietnamVirgin Islands (U.S.)West Bank and GazaWorldYemen, Rep.ZambiaZimbabwe Timeline:
This timeline shows a graph from 1961 to 2016 of Turkey. No data until 1960. Number of actual observations by date: 56.
Source name:
World Development Indicators
Source organization:
World Bank Staff estimates based on United Nations, World Urbanization Prospects.
Categories, topics:
Agriculture & Rural Development
Last updated:
apr 23, 2017
Indicators value changes by year
Minimum:
26.603
jan 1, 2016
Maximum:
68.485
jan 1, 1961
At the date of observation
Value
Absolute change
Change from previous value
jan 1, 1961
68.485
+68.485
0.0%
jan 1, 1962
67.936
-0.549
-0.8%
jan 1, 1963
67.402
-0.534
-0.79%
jan 1, 1964
66.863
-0.539
-0.8%
jan 1, 1965
66.32
-0.543
-0.81%
jan 1, 1966
65.773
-0.547
-0.82%
jan 1, 1967
65.051
-0.722
-1.1%
jan 1, 1968
64.241
-0.81
-1.25%
jan 1, 1969
63.423
-0.818
-1.27%
jan 1, 1970
62.599
-0.824
-1.3%
jan 1, 1971
61.766
-0.833
-1.33%
jan 1, 1972
61.055
-0.711
-1.15%
jan 1, 1973
60.4
-0.655
-1.07%
jan 1, 1974
59.742
-0.658
-1.09%
jan 1, 1975
59.08
-0.662
-1.11%
jan 1, 1976
58.414
-0.666
-1.13%
jan 1, 1977
57.913
-0.501
-0.86%
jan 1, 1978
57.492
-0.421
-0.73%
jan 1, 1979
57.069
-0.423
-0.74%
jan 1, 1980
56.645
-0.424
-0.74%
jan 1, 1981
56.22
-0.425
-0.75%
jan 1, 1982
54.811
-1.409
-2.51%
jan 1, 1983
53.003
-1.808
-3.3%
jan 1, 1984
51.188
-1.815
-3.42%
jan 1, 1985
49.366
-1.822
-3.56%
jan 1, 1986
47.552
-1.814
-3.67%
jan 1, 1987
46.07
-1.482
-3.12%
jan 1, 1988
44.739
-1.331
-2.89%
jan 1, 1989
43.413
-1.326
-2.96%
jan 1, 1990
42.101
-1.312
-3.02%
jan 1, 1991
40.797
-1.304
-3.1%
jan 1, 1992
40.024
-0.773
-1.89%
jan 1, 1993
39.482
-0.542
-1.35%
jan 1, 1994
38.945
-0.537
-1.36%
jan 1, 1995
38.41
-0.535
-1.37%
jan 1, 1996
37.877
-0.533
-1.39%
jan 1, 1997
37.347
-0.53
-1.4%
jan 1, 1998
36.821
-0.526
-1.41%
jan 1, 1999
36.297
-0.524
-1.42%
jan 1, 2000
35.777
-0.52
-1.43%
jan 1, 2001
35.259
-0.518
-1.45%
jan 1, 2002
34.668
-0.591
-1.68%
jan 1, 2003
34.047
-0.621
-1.79%
jan 1, 2004
33.431
-0.616
-1.81%
jan 1, 2005
32.82
-0.611
-1.83%
jan 1, 2006
32.217
-0.603
-1.84%
jan 1, 2007
31.618
-0.599
-1.86%
jan 1, 2008
31.025
-0.593
-1.88%
jan 1, 2009
30.438
-0.587
-1.89%
jan 1, 2010
29.859
-0.579
-1.9%
jan 1, 2011
29.285
-0.574
-1.92%
jan 1, 2012
28.718
-0.567
-1.94%
jan 1, 2013
28.166
-0.552
-1.92%
jan 1, 2014
27.63
-0.536
-1.9%
jan 1, 2015
27.109
-0.521
-1.89%
jan 1, 2016
26.603
-0.506
-1.87%
Ranking of countries by current statistics by years


Comments: