29
/
en
AIzaSyAYiBZKx7MnpbEhh9jyipgxe19OcubqV5w
April 1, 2024
40317
IDA total
IDA
false
2
1
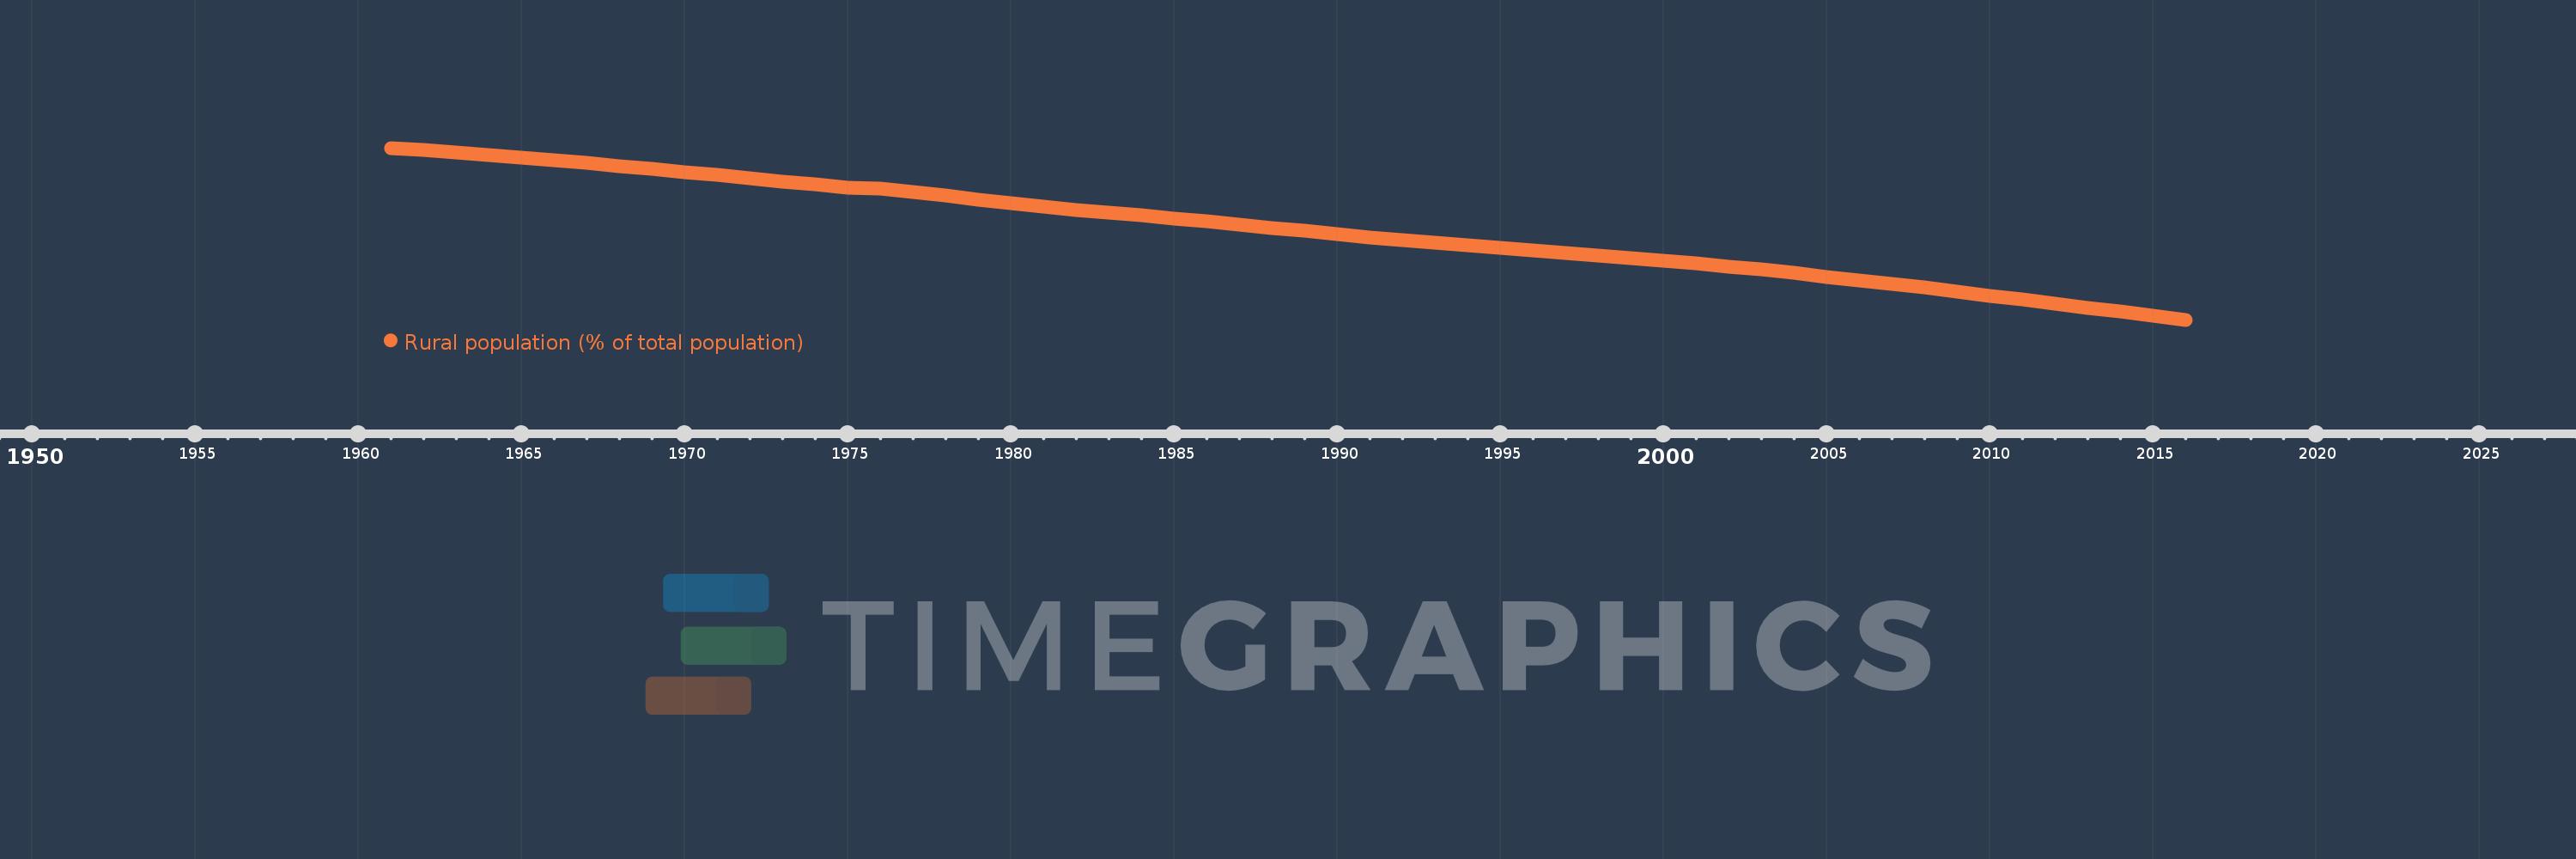
Rural population (% of total population)
2016,2015,2014,2013,2012,2011,2010,2009,2008,2007,2006,2005,2004,2003,2002,2001,2000,1999,1998,1997,1996,1995,1994,1993,1992,1991,1990,1989,1988,1987,1986,1985,1984,1983,1982,1981,1980,1979,1978,1977,1976,1975,1974,1973,1972,1971,1970,1969,1968,1967,1966,1965,1964,1963,1962,1961
This statistics in other country:
AfghanistanAlbaniaAlgeriaAmerican SamoaAndorraAngolaAntigua and BarbudaArab WorldArgentinaArmeniaArubaAustraliaAustriaAzerbaijanBahamas, TheBahrainBangladeshBarbadosBelarusBelgiumBelizeBeninBermudaBhutanBoliviaBosnia and HerzegovinaBotswanaBrazilBritish Virgin IslandsBrunei DarussalamBulgariaBurkina FasoBurundiCabo VerdeCambodiaCameroonCanadaCaribbean small statesCayman IslandsCentral African RepublicCentral Europe and the BalticsChadChannel IslandsChileChinaColombiaComorosCongo, Dem. Rep.Congo, Rep.Costa RicaCote d'IvoireCroatiaCubaCuracaoCyprusCzech RepublicDenmarkDjiboutiDominicaDominican RepublicEarly-demographic dividendEast Asia & PacificEast Asia & Pacific (excluding high income)East Asia & Pacific (IDA & IBRD countries)EcuadorEgypt, Arab Rep.El SalvadorEquatorial GuineaEritreaEstoniaEthiopiaEuro areaEurope & Central AsiaEurope & Central Asia (excluding high income)Europe & Central Asia (IDA & IBRD countries)European UnionFaroe IslandsFijiFinlandFragile and conflict affected situationsFranceFrench PolynesiaGabonGambia, TheGeorgiaGermanyGhanaGibraltarGreeceGreenlandGrenadaGuamGuatemalaGuineaGuinea-BissauGuyanaHaitiHeavily indebted poor countries (HIPC)High incomeHondurasHong Kong SAR, ChinaHungaryIBRD onlyIcelandIDA & IBRD totalIDA blendIDA onlyIDA totalIndiaIndonesiaIran, Islamic Rep.IraqIrelandIsle of ManIsraelItalyJamaicaJapanJordanKazakhstanKenyaKiribatiKorea, Dem. People’s Rep.Korea, Rep.KuwaitKyrgyz RepublicLao PDRLate-demographic dividendLatin America & Caribbean Latin America & Caribbean (excluding high income)Latin America & the Caribbean (IDA & IBRD countries)LatviaLeast developed countries: UN classificationLebanonLesothoLiberiaLibyaLiechtensteinLithuaniaLow & middle incomeLow incomeLower middle incomeLuxembourgMacao SAR, ChinaMacedonia, FYRMadagascarMalawiMalaysiaMaldivesMaliMaltaMarshall IslandsMauritaniaMauritiusMexicoMicronesia, Fed. Sts.Middle East & North AfricaMiddle East & North Africa (excluding high income)Middle East & North Africa (IDA & IBRD countries)Middle incomeMoldovaMonacoMongoliaMontenegroMoroccoMozambiqueMyanmarNamibiaNauruNepalNetherlandsNew CaledoniaNew ZealandNicaraguaNigerNigeriaNorth AmericaNorthern Mariana IslandsNorwayOECD membersOmanOther small statesPacific island small statesPakistanPalauPanamaPapua New GuineaParaguayPeruPhilippinesPolandPortugalPost-demographic dividendPre-demographic dividendPuerto RicoQatarRomaniaRussian FederationRwandaSamoaSan MarinoSao Tome and PrincipeSaudi ArabiaSenegalSerbiaSeychellesSierra LeoneSingaporeSint Maarten (Dutch part)Slovak RepublicSloveniaSmall statesSolomon IslandsSomaliaSouth AfricaSouth AsiaSouth Asia (IDA & IBRD)South SudanSpainSri LankaSt. Kitts and NevisSt. LuciaSt. Vincent and the GrenadinesSub-Saharan Africa Sub-Saharan Africa (excluding high income)Sub-Saharan Africa (IDA & IBRD countries)SudanSurinameSwazilandSwedenSwitzerlandSyrian Arab RepublicTajikistanTanzaniaThailandTimor-LesteTogoTongaTrinidad and TobagoTunisiaTurkeyTurkmenistanTurks and Caicos IslandsTuvaluUgandaUkraineUnited Arab EmiratesUnited KingdomUnited StatesUpper middle incomeUruguayUzbekistanVanuatuVenezuela, RBVietnamVirgin Islands (U.S.)West Bank and GazaWorldYemen, Rep.ZambiaZimbabwe Timeline:
This timeline shows a graph from 1961 to 2016 of IDA total. No data until 1960. Number of actual observations by date: 56.
Source name:
World Development Indicators
Source organization:
World Bank Staff estimates based on United Nations, World Urbanization Prospects.
Categories, topics:
Agriculture & Rural Development
Last updated:
apr 23, 2017
Indicators value changes by year
Minimum:
64.305
jan 1, 2016
Maximum:
85.958
jan 1, 1961
At the date of observation
Value
Absolute change
Change from previous value
jan 1, 1961
85.958
+85.958
0.0%
jan 1, 1962
85.656
-0.303
-0.35%
jan 1, 1963
85.353
-0.303
-0.35%
jan 1, 1964
85.038
-0.315
-0.37%
jan 1, 1965
84.708
-0.329
-0.39%
jan 1, 1966
84.373
-0.336
-0.4%
jan 1, 1967
84.038
-0.335
-0.4%
jan 1, 1968
83.682
-0.356
-0.42%
jan 1, 1969
83.316
-0.366
-0.44%
jan 1, 1970
82.936
-0.38
-0.46%
jan 1, 1971
82.552
-0.384
-0.46%
jan 1, 1972
82.151
-0.4
-0.49%
jan 1, 1973
81.748
-0.403
-0.49%
jan 1, 1974
81.337
-0.411
-0.5%
jan 1, 1975
80.919
-0.418
-0.51%
jan 1, 1976
80.806
-0.113
-0.14%
jan 1, 1977
80.368
-0.438
-0.54%
jan 1, 1978
79.921
-0.447
-0.56%
jan 1, 1979
79.461
-0.46
-0.58%
jan 1, 1980
79.027
-0.433
-0.55%
jan 1, 1981
78.578
-0.45
-0.57%
jan 1, 1982
78.146
-0.431
-0.55%
jan 1, 1983
77.807
-0.339
-0.43%
jan 1, 1984
77.452
-0.355
-0.46%
jan 1, 1985
77.077
-0.375
-0.48%
jan 1, 1986
76.686
-0.391
-0.51%
jan 1, 1987
76.294
-0.392
-0.51%
jan 1, 1988
75.902
-0.393
-0.51%
jan 1, 1989
75.507
-0.395
-0.52%
jan 1, 1990
75.116
-0.391
-0.52%
jan 1, 1991
74.703
-0.413
-0.55%
jan 1, 1992
74.344
-0.359
-0.48%
jan 1, 1993
73.997
-0.347
-0.47%
jan 1, 1994
73.662
-0.336
-0.45%
jan 1, 1995
73.353
-0.309
-0.42%
jan 1, 1996
73.047
-0.307
-0.42%
jan 1, 1997
72.738
-0.309
-0.42%
jan 1, 1998
72.42
-0.318
-0.44%
jan 1, 1999
72.102
-0.318
-0.44%
jan 1, 2000
71.779
-0.323
-0.45%
jan 1, 2001
71.437
-0.342
-0.48%
jan 1, 2002
71.036
-0.402
-0.56%
jan 1, 2003
70.613
-0.422
-0.59%
jan 1, 2004
70.181
-0.432
-0.61%
jan 1, 2005
69.739
-0.443
-0.63%
jan 1, 2006
69.282
-0.457
-0.65%
jan 1, 2007
68.814
-0.468
-0.68%
jan 1, 2008
68.333
-0.481
-0.7%
jan 1, 2009
67.835
-0.498
-0.73%
jan 1, 2010
67.333
-0.501
-0.74%
jan 1, 2011
66.83
-0.504
-0.75%
jan 1, 2012
66.328
-0.502
-0.75%
jan 1, 2013
65.827
-0.5
-0.75%
jan 1, 2014
65.326
-0.502
-0.76%
jan 1, 2015
64.819
-0.507
-0.78%
jan 1, 2016
64.305
-0.514
-0.79%
Ranking of countries by current statistics by years


Comments: