29
/
en
AIzaSyAYiBZKx7MnpbEhh9jyipgxe19OcubqV5w
April 1, 2024
230398
Russian Federation
RUS
true
2
1
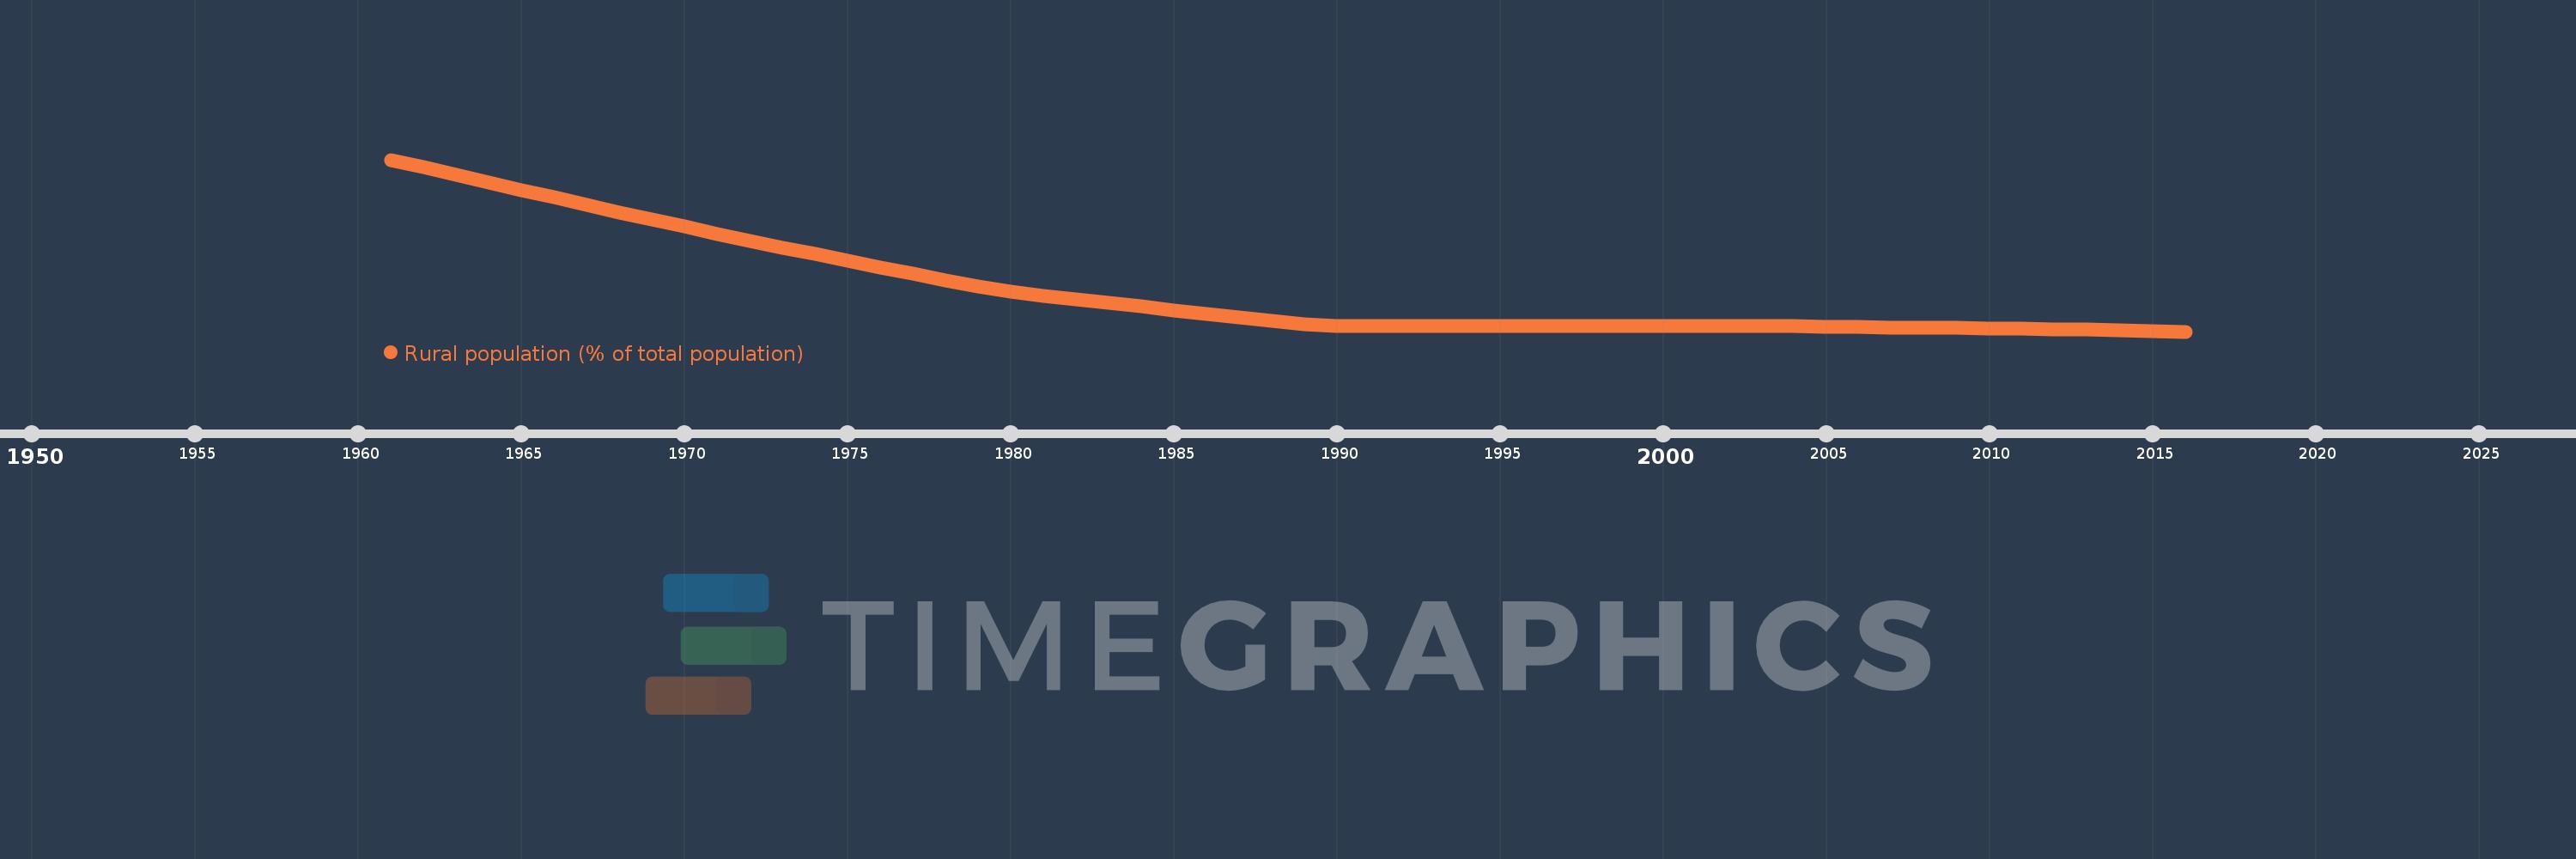
Rural population (% of total population)
2016,2015,2014,2013,2012,2011,2010,2009,2008,2007,2006,2005,2004,2003,2002,2001,2000,1999,1998,1997,1996,1995,1994,1993,1992,1991,1990,1989,1988,1987,1986,1985,1984,1983,1982,1981,1980,1979,1978,1977,1976,1975,1974,1973,1972,1971,1970,1969,1968,1967,1966,1965,1964,1963,1962,1961
This statistics in other country:
AfghanistanAlbaniaAlgeriaAmerican SamoaAndorraAngolaAntigua and BarbudaArab WorldArgentinaArmeniaArubaAustraliaAustriaAzerbaijanBahamas, TheBahrainBangladeshBarbadosBelarusBelgiumBelizeBeninBermudaBhutanBoliviaBosnia and HerzegovinaBotswanaBrazilBritish Virgin IslandsBrunei DarussalamBulgariaBurkina FasoBurundiCabo VerdeCambodiaCameroonCanadaCaribbean small statesCayman IslandsCentral African RepublicCentral Europe and the BalticsChadChannel IslandsChileChinaColombiaComorosCongo, Dem. Rep.Congo, Rep.Costa RicaCote d'IvoireCroatiaCubaCuracaoCyprusCzech RepublicDenmarkDjiboutiDominicaDominican RepublicEarly-demographic dividendEast Asia & PacificEast Asia & Pacific (excluding high income)East Asia & Pacific (IDA & IBRD countries)EcuadorEgypt, Arab Rep.El SalvadorEquatorial GuineaEritreaEstoniaEthiopiaEuro areaEurope & Central AsiaEurope & Central Asia (excluding high income)Europe & Central Asia (IDA & IBRD countries)European UnionFaroe IslandsFijiFinlandFragile and conflict affected situationsFranceFrench PolynesiaGabonGambia, TheGeorgiaGermanyGhanaGibraltarGreeceGreenlandGrenadaGuamGuatemalaGuineaGuinea-BissauGuyanaHaitiHeavily indebted poor countries (HIPC)High incomeHondurasHong Kong SAR, ChinaHungaryIBRD onlyIcelandIDA & IBRD totalIDA blendIDA onlyIDA totalIndiaIndonesiaIran, Islamic Rep.IraqIrelandIsle of ManIsraelItalyJamaicaJapanJordanKazakhstanKenyaKiribatiKorea, Dem. People’s Rep.Korea, Rep.KuwaitKyrgyz RepublicLao PDRLate-demographic dividendLatin America & Caribbean Latin America & Caribbean (excluding high income)Latin America & the Caribbean (IDA & IBRD countries)LatviaLeast developed countries: UN classificationLebanonLesothoLiberiaLibyaLiechtensteinLithuaniaLow & middle incomeLow incomeLower middle incomeLuxembourgMacao SAR, ChinaMacedonia, FYRMadagascarMalawiMalaysiaMaldivesMaliMaltaMarshall IslandsMauritaniaMauritiusMexicoMicronesia, Fed. Sts.Middle East & North AfricaMiddle East & North Africa (excluding high income)Middle East & North Africa (IDA & IBRD countries)Middle incomeMoldovaMonacoMongoliaMontenegroMoroccoMozambiqueMyanmarNamibiaNauruNepalNetherlandsNew CaledoniaNew ZealandNicaraguaNigerNigeriaNorth AmericaNorthern Mariana IslandsNorwayOECD membersOmanOther small statesPacific island small statesPakistanPalauPanamaPapua New GuineaParaguayPeruPhilippinesPolandPortugalPost-demographic dividendPre-demographic dividendPuerto RicoQatarRomaniaRussian FederationRwandaSamoaSan MarinoSao Tome and PrincipeSaudi ArabiaSenegalSerbiaSeychellesSierra LeoneSingaporeSint Maarten (Dutch part)Slovak RepublicSloveniaSmall statesSolomon IslandsSomaliaSouth AfricaSouth AsiaSouth Asia (IDA & IBRD)South SudanSpainSri LankaSt. Kitts and NevisSt. LuciaSt. Vincent and the GrenadinesSub-Saharan Africa Sub-Saharan Africa (excluding high income)Sub-Saharan Africa (IDA & IBRD countries)SudanSurinameSwazilandSwedenSwitzerlandSyrian Arab RepublicTajikistanTanzaniaThailandTimor-LesteTogoTongaTrinidad and TobagoTunisiaTurkeyTurkmenistanTurks and Caicos IslandsTuvaluUgandaUkraineUnited Arab EmiratesUnited KingdomUnited StatesUpper middle incomeUruguayUzbekistanVanuatuVenezuela, RBVietnamVirgin Islands (U.S.)West Bank and GazaWorldYemen, Rep.ZambiaZimbabwe Timeline:
This timeline shows a graph from 1961 to 2016 of Russian Federation. No data until 1960. Number of actual observations by date: 56.
Source name:
World Development Indicators
Source organization:
World Bank Staff estimates based on United Nations, World Urbanization Prospects.
Categories, topics:
Agriculture & Rural Development
Last updated:
apr 23, 2017
Indicators value changes by year
Minimum:
25.992
jan 1, 2016
Maximum:
46.269
jan 1, 1961
At the date of observation
Value
Absolute change
Change from previous value
jan 1, 1961
46.269
+46.269
0.0%
jan 1, 1962
45.374
-0.895
-1.93%
jan 1, 1963
44.482
-0.892
-1.97%
jan 1, 1964
43.592
-0.89
-2.0%
jan 1, 1965
42.706
-0.886
-2.03%
jan 1, 1966
41.827
-0.879
-2.06%
jan 1, 1967
40.952
-0.875
-2.09%
jan 1, 1968
40.082
-0.87
-2.12%
jan 1, 1969
39.217
-0.865
-2.16%
jan 1, 1970
38.362
-0.855
-2.18%
jan 1, 1971
37.529
-0.833
-2.17%
jan 1, 1972
36.722
-0.807
-2.15%
jan 1, 1973
35.922
-0.8
-2.18%
jan 1, 1974
35.131
-0.791
-2.2%
jan 1, 1975
34.348
-0.783
-2.23%
jan 1, 1976
33.573
-0.775
-2.26%
jan 1, 1977
32.806
-0.767
-2.28%
jan 1, 1978
32.05
-0.756
-2.3%
jan 1, 1979
31.302
-0.748
-2.33%
jan 1, 1980
30.695
-0.607
-1.94%
jan 1, 1981
30.249
-0.446
-1.45%
jan 1, 1982
29.807
-0.442
-1.46%
jan 1, 1983
29.369
-0.438
-1.47%
jan 1, 1984
28.934
-0.435
-1.48%
jan 1, 1985
28.503
-0.431
-1.49%
jan 1, 1986
28.077
-0.426
-1.49%
jan 1, 1987
27.654
-0.423
-1.51%
jan 1, 1988
27.235
-0.419
-1.52%
jan 1, 1989
26.819
-0.416
-1.53%
jan 1, 1990
26.602
-0.217
-0.81%
jan 1, 1991
26.606
+0.004
0.02%
jan 1, 1992
26.611
+0.005
0.02%
jan 1, 1993
26.615
+0.004
0.02%
jan 1, 1994
26.619
+0.004
0.02%
jan 1, 1995
26.624
+0.005
0.02%
jan 1, 1996
26.628
+0.004
0.02%
jan 1, 1997
26.633
+0.005
0.02%
jan 1, 1998
26.637
+0.004
0.02%
jan 1, 1999
26.641
+0.004
0.02%
jan 1, 2000
26.646
+0.005
0.02%
jan 1, 2001
26.65
+0.004
0.02%
jan 1, 2002
26.654
+0.004
0.02%
jan 1, 2003
26.659
+0.005
0.02%
jan 1, 2004
26.627
-0.032
-0.12%
jan 1, 2005
26.582
-0.045
-0.17%
jan 1, 2006
26.537
-0.045
-0.17%
jan 1, 2007
26.492
-0.045
-0.17%
jan 1, 2008
26.447
-0.045
-0.17%
jan 1, 2009
26.402
-0.045
-0.17%
jan 1, 2010
26.358
-0.044
-0.17%
jan 1, 2011
26.313
-0.045
-0.17%
jan 1, 2012
26.268
-0.045
-0.17%
jan 1, 2013
26.214
-0.054
-0.21%
jan 1, 2014
26.149
-0.065
-0.25%
jan 1, 2015
26.076
-0.073
-0.28%
jan 1, 2016
25.992
-0.084
-0.32%
Ranking of countries by current statistics by years


Comments: